GUIDE
What Are Flow Metrics? Cycle Time, WIP and Flow Distribution Explained
Cycle time, work in progress, throughput and flow distribution — the numbers that describe how work actually moves through a team, as opposed to how a burndown chart says it should.
Where "flow metrics" comes from
The term is most closely associated with the Flow Framework, introduced by Mik Kersten in his book Project to Product. It borrows heavily from Lean and Kanban thinking — the same lineage that gave software teams the idea of visualizing work as it moves through stages, rather than only measuring output at the end. The Flow Framework names five official metrics: Flow Velocity, Flow Time, Flow Efficiency, Flow Load and Flow Distribution — in everyday use, most teams know these by their more common names: throughput, cycle time, WIP, and category breakdown.
The core flow metrics
| Metric | What it measures | Why it matters |
|---|---|---|
| Cycle Time (Flow Time) | How long an item takes from start to finish. | Whether work is actually getting done faster over time. |
| WIP (Flow Load) | How many items are in progress at once. | Too much WIP is one of the biggest drivers of slow cycle time. |
| Throughput (Flow Velocity) | How many items get completed in a period. | Raw output, but only meaningful alongside the other metrics. |
| Flow Distribution | The mix of work by category — feature, defect, debt, risk. | Shows how much capacity actually goes to new value vs. everything else. |
| Flow Efficiency | Share of cycle time spent actively worked on, vs. waiting. | Exposes hidden queue time that a cycle time number alone hides. |
| Backlog Health | Backlog size, aging, stale items and runway. | Not one of the Flow Framework's original 5 — but the same lineage of question, about what's not being worked on yet. |
moasy.tech computes Flow Velocity, Flow Time (Cycle Time), Flow Load (WIP), Flow Distribution and Backlog Health today. Flow Efficiency — which needs active-vs-wait time tracked per status — isn't one of them yet.
Why teams track them
A single number like "we shipped 40 items this month" doesn't say whether that's good — 40 tiny bug fixes and 40 substantial features tell very different stories. Flow metrics work together: cycle time and WIP tell you about speed and where work gets stuck, throughput tells you about raw output, and flow distribution tells you what kind of work that output actually was. Looking at all of them together turns "we shipped 40 items" into something you can actually act on.
How teams usually calculate them manually (and where it gets messy)
All of this is derivable from your issue tracker's history — timestamps of status changes are usually enough for cycle time and WIP, and issue type or labels can drive a distribution breakdown. What tends to break down:
- Every team draws category boundaries differently — one team's "Bug" is another team's "Feature" (a fix ships as new functionality), and forcing one fixed taxonomy on every team produces numbers nobody trusts.
- Cycle time as a single average hides the distribution — a handful of items stuck for months can make a team look worse (or hide a team that's actually struggling) if you only look at the mean.
- WIP is easy to undercount if "in progress" isn't kept up to date consistently across every board.
How moasy.tech computes it automatically
moasy.tech recalculates WIP, throughput and cycle time (median, average and sample size) from what's already synced from Jira and Linear — read-only, no manual rollups. Category classification (Bug, Feature, Technical Debt, Toil and Risk — moasy.tech's own take on flow distribution, closer to how engineering teams actually talk than the Flow Framework's original four buckets) comes from semantic rules you configure yourself, not a fixed taxonomy — set a company-wide default, then let each team override it. No AI in the pipeline.
See the other flow metrics in this cluster: Cycle Time, Work in Progress, Flow Distribution, Velocity and Backlog Health, or the complete implementation on the Flow Metrics feature page.
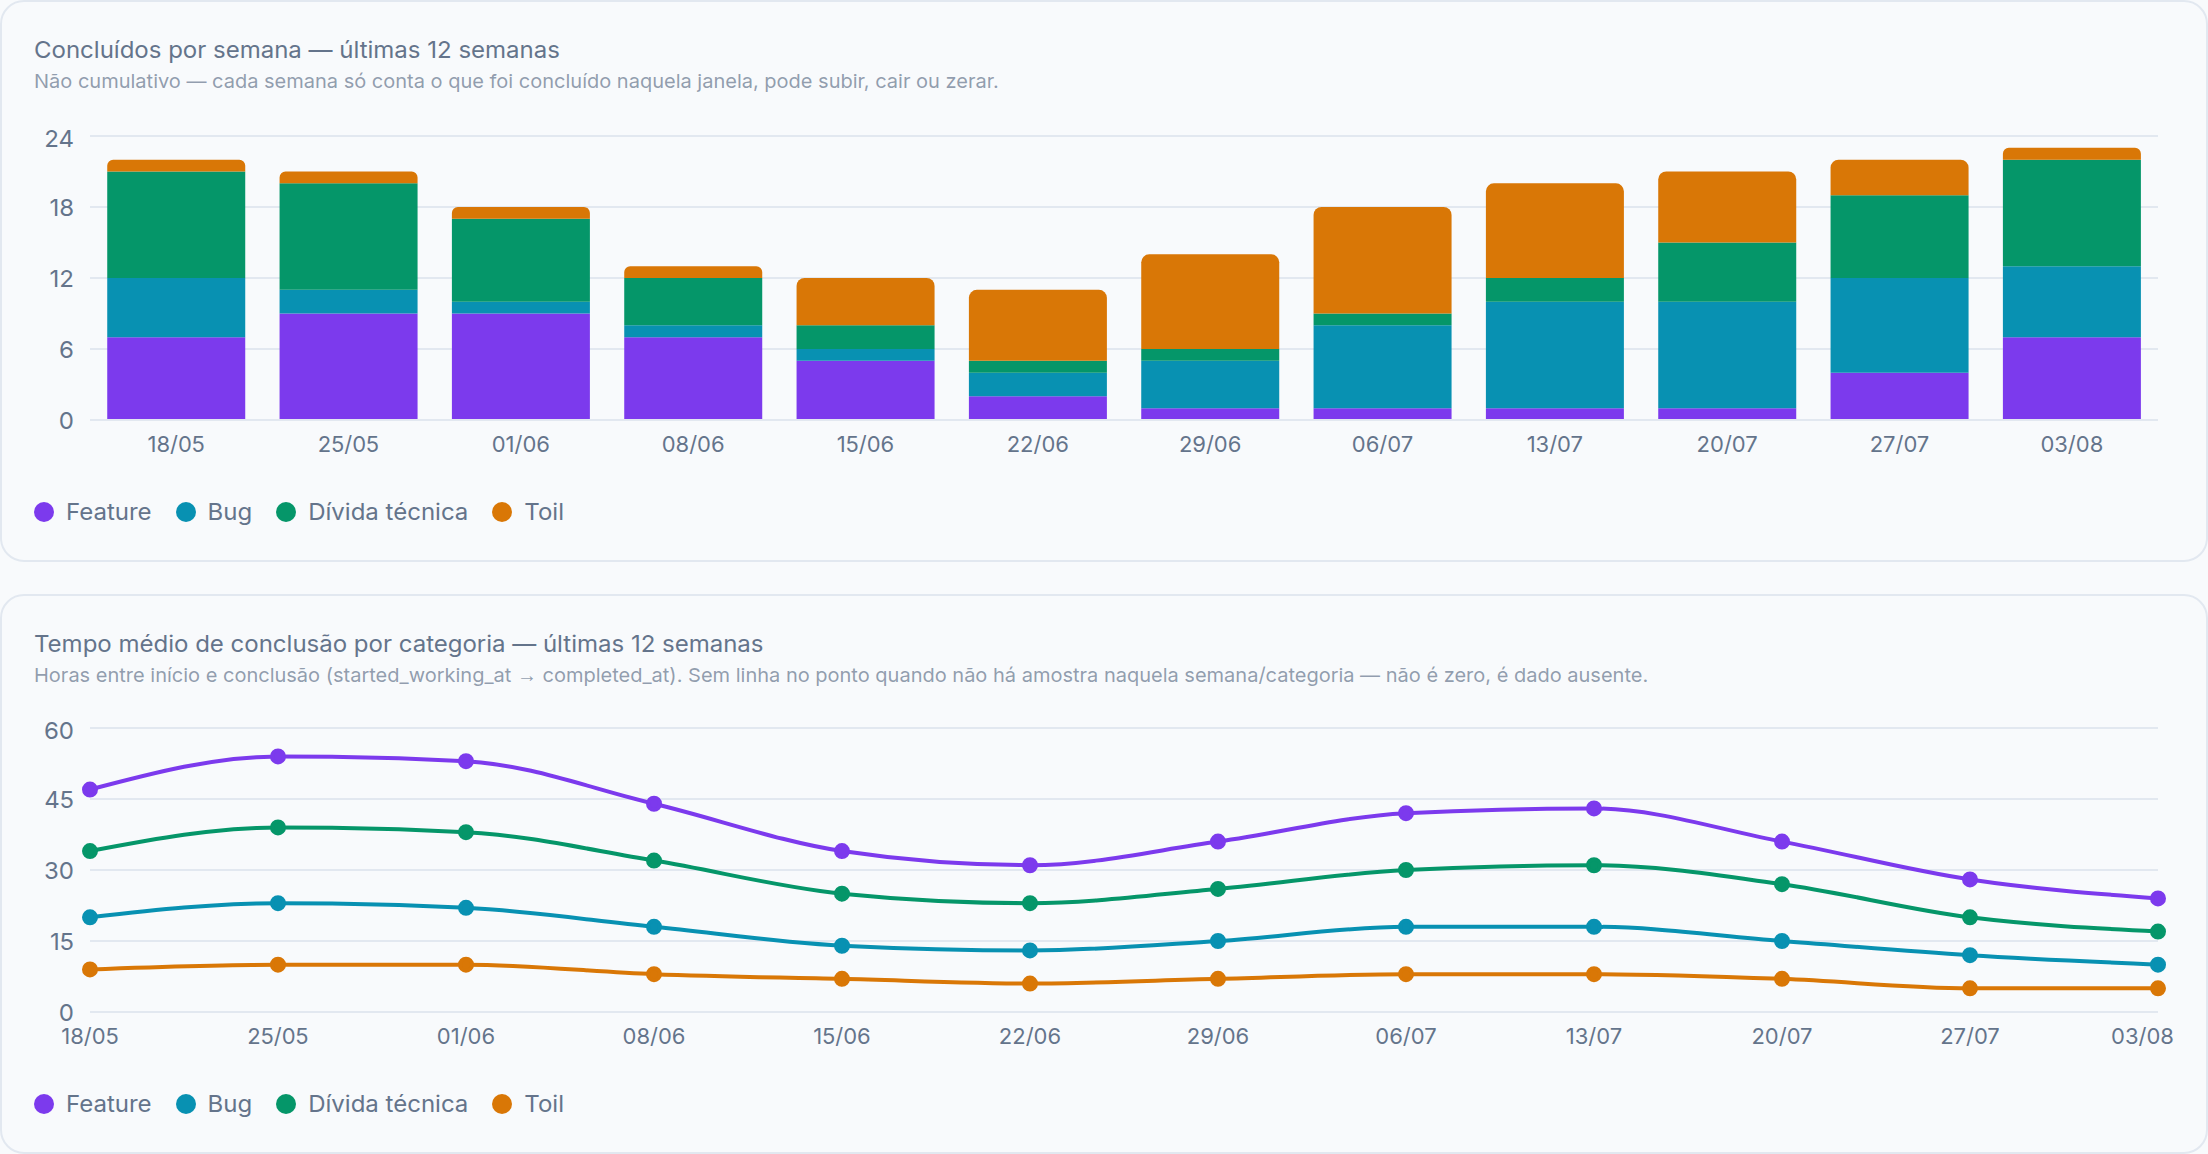
Illustrative data, for demonstration purposes only.
Questions about flow metrics
Do I need a tool to track flow metrics?
No — cycle time, WIP and a category breakdown are all derivable straight from your issue tracker's history. It's manual work, and category definitions tend to drift team to team without a shared, configurable set of rules.
Are flow metrics the same as DORA metrics?
No, though they're often tracked together. DORA metrics focus on the software delivery pipeline specifically — deploys, incidents. Flow metrics are broader, describing how any kind of work item moves through a team, including work that never touches production. See the DORA Metrics guide for that side.
Does the Flow Framework require Jira specifically?
No — it's a set of concepts, not a tool. Any issue tracker with status history (Jira, Linear, and others) can produce these metrics.
See your own flow metrics
Get started free