GUIDE
Cycle Time: What It Is and How to Calculate It
A core flow metric (also called Flow Time in the Flow Framework) — how long an item takes from start to finish.
What it measures
Cycle time is the time between work starting on an item and it being finished — typically from the moment a ticket moves to "In Progress" (or an equivalent status) to the moment it's marked done. It answers a narrower question than "how long did this take overall": it excludes time spent sitting untouched in a backlog, focusing on the period once someone actually picked it up.
Why it matters
Cycle time is one of the clearest signals of whether a team is actually speeding up or slowing down over time — a trend line matters more here than any single number. It's also closely tied to WIP: teams that take on too much work in progress at once almost always see their cycle time stretch out, since attention gets split across more items than anyone can move forward at the same pace.
It's also the number that makes a roadmap estimate honest. "This will take about a week" is a guess unless it's grounded in what similar work has actually taken recently — cycle time, tracked by category, is exactly that grounding. A team that knows its median cycle time for a typical feature is 4 days can give a commitment with real confidence behind it; a team that doesn't is estimating from memory, which tends to be optimistic.
How to calculate it
For each completed item, subtract the timestamp it entered "In Progress" from the timestamp it was marked done, then look at the distribution across a set of items — median and average together, not just one. A median tells you what a typical item experiences; an average alone can be dragged far in either direction by a handful of items that got stuck for weeks or finished unusually fast.
A quick example: 8 items finish in a week, with cycle times of 4h, 6h, 8h, 10h, 14h, 20h, 30h and 180h — one item that sat blocked for over a week. The median is 12h, a reasonable read on a typical item. The average, 34h, is dragged up almost entirely by the one blocked item — which is exactly why cycle time is usually reported as a median with the average alongside it, not the average alone.
A common trap
Splitting large items into artificially small ones right before starting work will shrink cycle time on paper without the team actually delivering any faster — the total time to ship the same outcome doesn't change, it's just spread across more tickets that each look quick individually. Cycle time is most useful compared against a team's own recent history for similarly-sized work, not as an absolute number to minimize at all costs.
How moasy.tech computes it
moasy.tech recalculates cycle time — median, average and sample size — automatically from what's already synced from Jira and Linear, broken down by the same team-configurable categories (Bug, Feature, Technical Debt, Toil, Risk) used across Flow Metrics, with a week-by-week trend so a shift in the number is a real trend, not two snapshots compared by hand.
See the other flow metrics in the full guide, or the complete implementation on the Flow Metrics feature page.
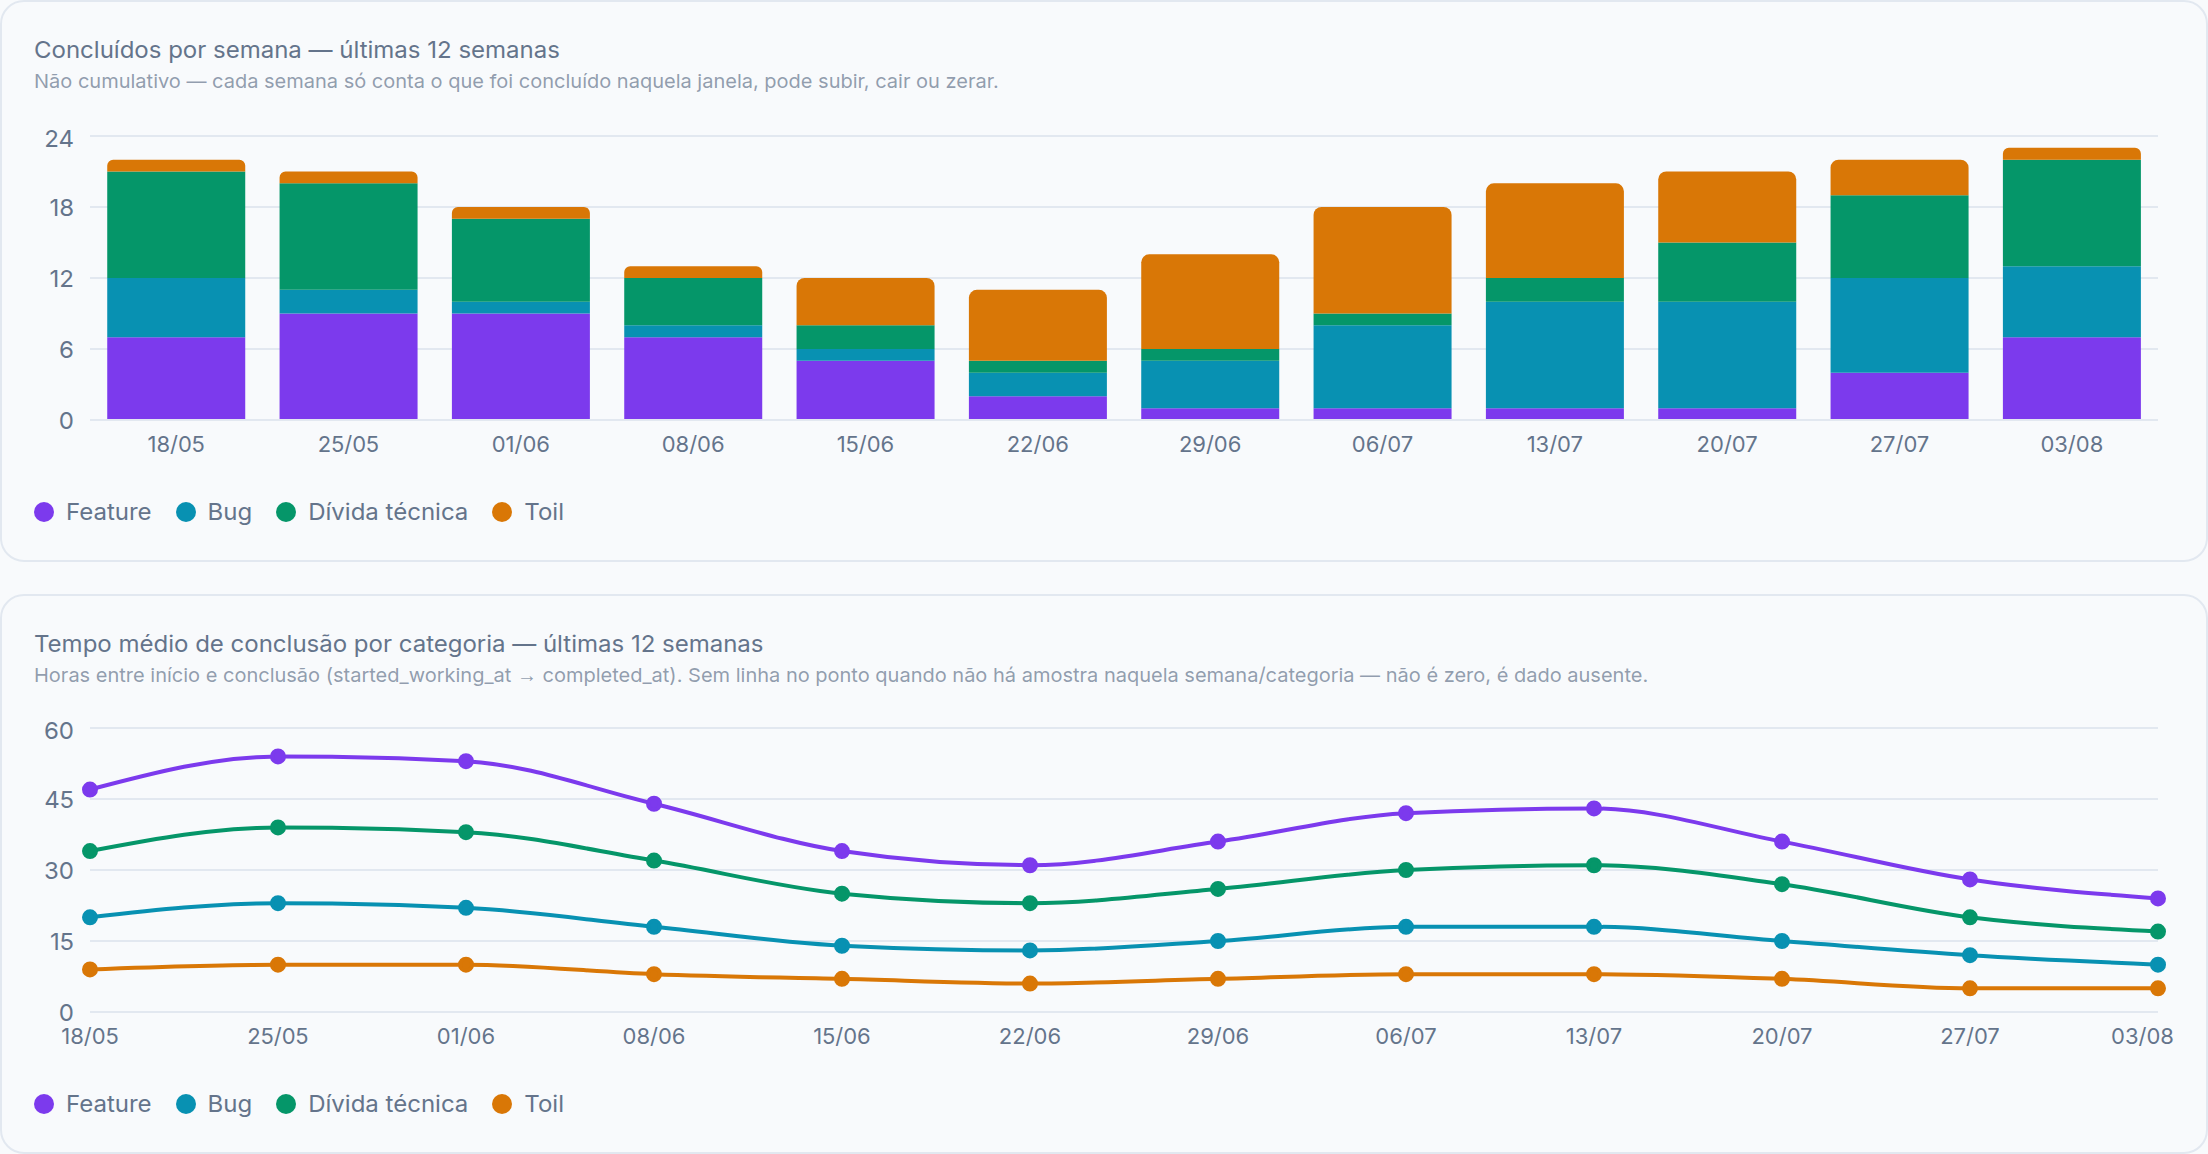
Illustrative data, for demonstration purposes only.
Questions about cycle time
Is cycle time the same as lead time for changes?
Related, but not identical. Cycle time usually starts when work begins on an item; lead time for changes (a DORA metric) starts later, at the commit or merge, and ends specifically at a production deploy. See the Lead Time for Changes guide for that side.
Why look at median instead of just the average?
A handful of items stuck for an unusually long time can pull an average far higher than what most work actually experiences. Median shows what's typical; looking at both together also surfaces those stuck outliers instead of hiding them.
Should cycle time include time spent blocked, waiting on someone else?
Most teams count it, since the item genuinely hasn't finished yet — excluding blocked time would hide exactly the kind of delay that's most worth surfacing. If it's useful to separate the two, that's what Flow Efficiency (active time vs. total time) is for.
See your own cycle time
Get started free