Context, not just a number
A deployment frequency chart doesn't explain itself. A marker for "migrated payment provider" or "lost two engineers" right on the timeline does.
FEATURE
Manual events, config changes, incidents and epics — one chronological feed, so a dip in your metrics always has an explanation nearby.
Every team gets a consolidated timeline: manual events you log yourself (a departure, a migration, a deploy freeze), every change to your metric configuration (who changed what, and when), incidents, and epic start/completion markers — merged into one feed, each type with its own icon, filterable, over the last 4, 12 or 26 weeks. Click an epic entry and its start↔finish pair highlights together, so you can see the span without a Gantt chart. The same manual events also show up directly on your DORA and Flow trend charts, so a spike or a dip has an explanation right next to it, not a Slack thread you have to go dig up.
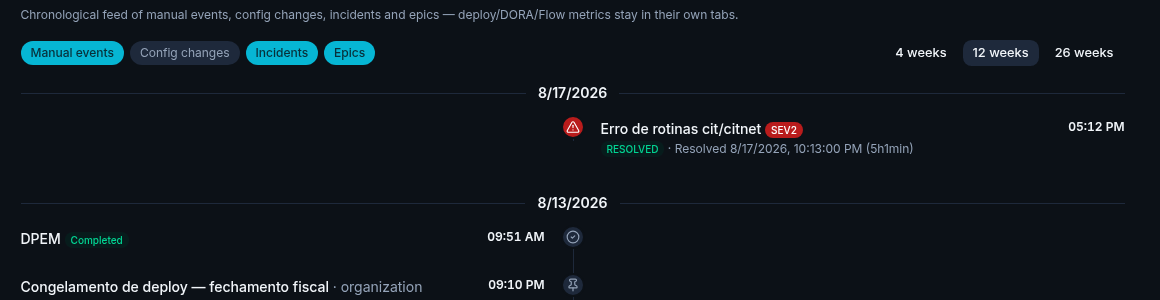
Illustrative data, for demonstration purposes only.
A departure, a migration, a deploy freeze — anything worth remembering that isn't already captured elsewhere, logged in a couple clicks.
Every change to a metric's trigger configuration is captured on its own — who changed it, and when — no manual logging needed for that part.
Incidents and epic start/completion markers from your synced integrations join the same feed, no separate entry.
Toggle each type on or off, over the last 4, 12 or 26 weeks — and see the same manual events plotted right on your DORA and Flow trend charts.
A deployment frequency chart doesn't explain itself. A marker for "migrated payment provider" or "lost two engineers" right on the timeline does.
Every change to a metric's trigger configuration is logged with who changed it and when — the same audit trail that already backs the "auditable, not opaque" DORA numbers.
A Gantt view shows exactly when each epic started and, if closed, finished — next to the same category breakdown you already get from Flow Metrics.
Toggle manual events, config changes, incidents or epics on and off — read the whole story, or just the part you're asking about.
A pin, a gear, a triangle, a play/check pair — each event type gets its own icon, so you can spot what you're looking for without reading every line.
No — only genuinely manual context (a departure, a migration, a freeze) needs logging by hand. Incidents and epic markers come from your synced integrations automatically, and every config change is captured automatically too.
Filterable to the last 4, 12 or 26 weeks.
Yes — a manual event or config change logged without a specific team attached shows up on every team's timeline, not just one. Incidents and epic markers don't have that org-wide concept; they're always tied to a single team.