Categories that match how your teams talk
No forcing every team into the same label scheme. Rules cascade: team config beats org config beats system default.
FEATURE
How much your team actually ships, and how long each kind of work takes — not vibes, not a burndown chart nobody trusts.
New to flow metrics? Read our plain-English guide to cycle time, WIP and flow distribution.
Distribution, WIP, velocity and cycle time, broken down by category — Bug, Feature, Technical Debt, Toil and Risk — classified by semantic rules you configure yourself, not a fixed taxonomy. Set a company-wide default, then let each team override it: what counts as Toil for one team can be a Feature for another.
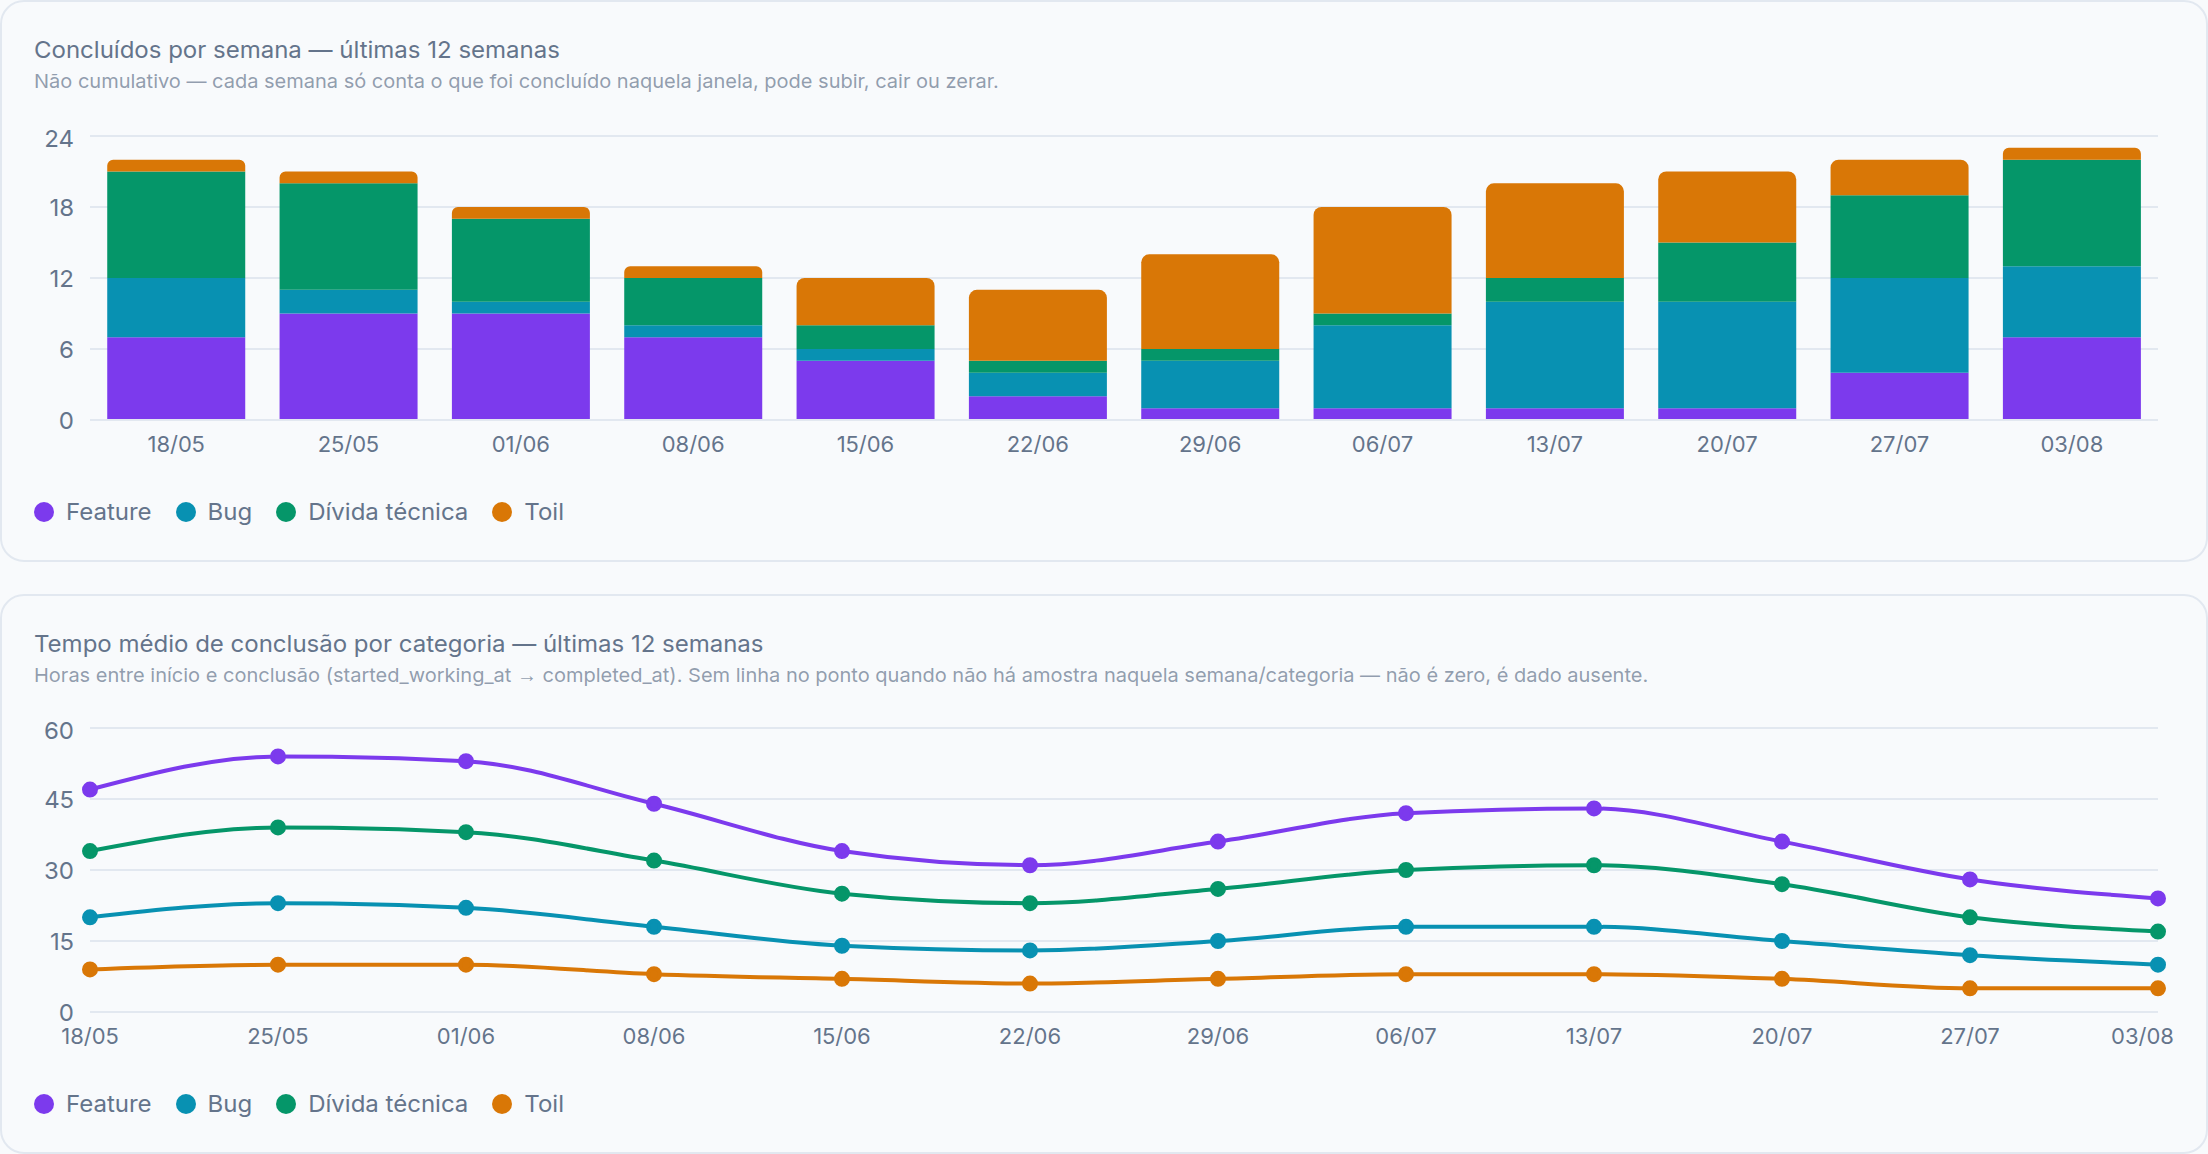
Illustrative data, for demonstration purposes only.
Break the same category breakdown down one level further — Team → Project → Epic → Item — to see where Bug, Feature and Toil work is really concentrated. A Gantt view shows exactly when each epic started and, if closed, finished. An item with no epic resolved yet shows up as its own "No epic" bucket, not silently dropped, and the epic boundary itself is configurable per team, same precedence as every other semantic rule. For which epics absorbed the most time across the whole team, see Activity Reports — a different question than this per-epic breakdown.
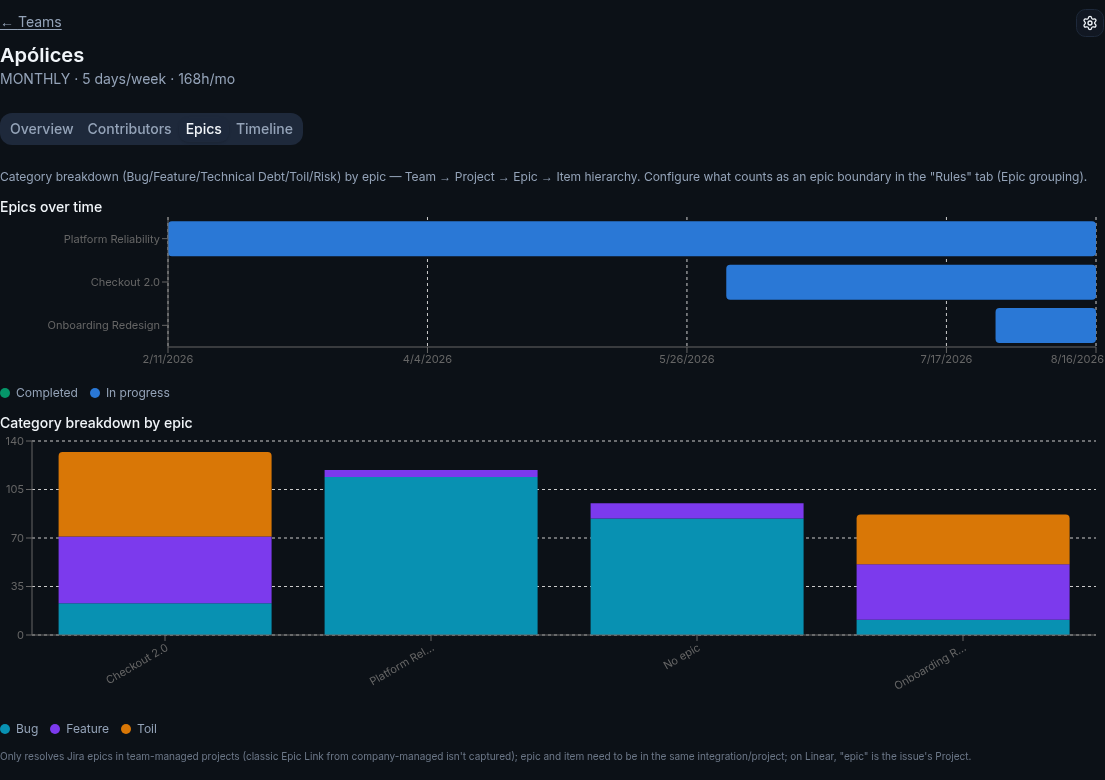
Illustrative data, for demonstration purposes only.
Backlog health turns "we have a lot of open items" into numbers you can act on: total backlog, how many items have gone untouched past a threshold you set (30 days by default), and — at your team's actual recent pace — how many weeks of work the current backlog represents. A bar chart breaks the same backlog down by age (0-7 days, 7-30, 30-90, 90-180, 180+), so "it's stale" becomes "half of it has been sitting for three months." Runway is a snapshot against recent velocity, not a forecast that accounts for new work still coming in; if velocity was zero for the period, it shows as unavailable instead of a meaningless divide-by-zero number.
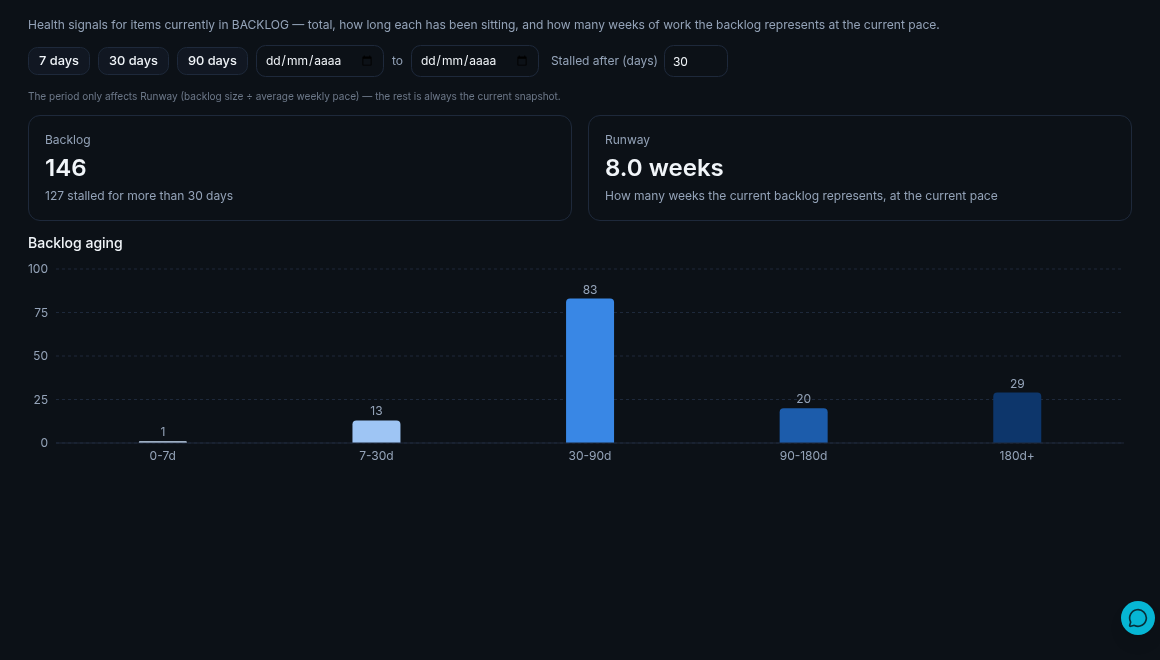
Illustrative data, for demonstration purposes only.
Jira, Linear and GitHub items sync incrementally — triggered manually or once a day on their own, never a full re-import.
Each item is matched against your semantic rules — team override beats org default — into Bug, Feature, Technical Debt, Toil or Risk, and grouped under its epic (or a "No epic" bucket if unresolved).
WIP, velocity, cycle time (median, average and sample size) and backlog health (total, stale, runway) are recalculated straight from the classified data — no AI in the loop.
Every metric keeps a week-by-week history, so a trend line is a real trend, not two snapshots compared by hand.
No forcing every team into the same label scheme. Rules cascade: team config beats org config beats system default.
Not just an average — median and sample size too, so a handful of outliers don't quietly define the number.
Every metric has a week-by-week history, so you see a team improving (or not) over time, not just where it stands today.
Work in progress per team is visible on its own, not buried inside a velocity chart.
The epic breakdown turns "we have a lot of Toil" into "this specific initiative is generating most of it" — a starting point for a real conversation, not just a number.
Total backlog on its own doesn't tell you much. Paired with how much of it is stale and how many weeks it represents at your real pace, it becomes something you can prioritize against.
Every Flow card on the dashboard is clickable — it opens a detail view with the individual work items that make up that number, not just the aggregate.
See Flow Metrics computed from your own data, not a demo.
Get started freeAnything that has gone untouched past a threshold you set, 30 days by default — no status change, no comment, nothing on the underlying Jira/Linear item. Adjust the threshold right on the Backlog tab if 30 days isn't the right bar for your team.
Total backlog divided by your team's average weekly velocity over the selected period — how many weeks of work the backlog in front of you represents, at the pace you're actually shipping. It's a snapshot against recent pace, not a forecast that accounts for new work still coming in.
It shows up in its own "No epic" bucket in the breakdown — never silently dropped from the count.