No manual rollups
Nobody's copying deploy counts into a spreadsheet every Friday. The numbers update as your tools sync, automatically.
FEATURE
The four metrics that tell you if engineering is actually getting better — deployment frequency, lead time, mean time to restore, change failure rate. Computed, not estimated.
New to DORA metrics? Read our plain-English guide to what they are and how to calculate them.
moasy.tech recalculates all four DORA metrics automatically from what's already synced from GitHub, GitHub Actions, ArgoCD, Vercel, Azure Pipelines, Waroom and incident.io — deployment frequency, lead time for changes, mean time to restore, and change failure rate. Filter by date range or by team, and every number comes with a trend line so you see the direction, not just the snapshot.
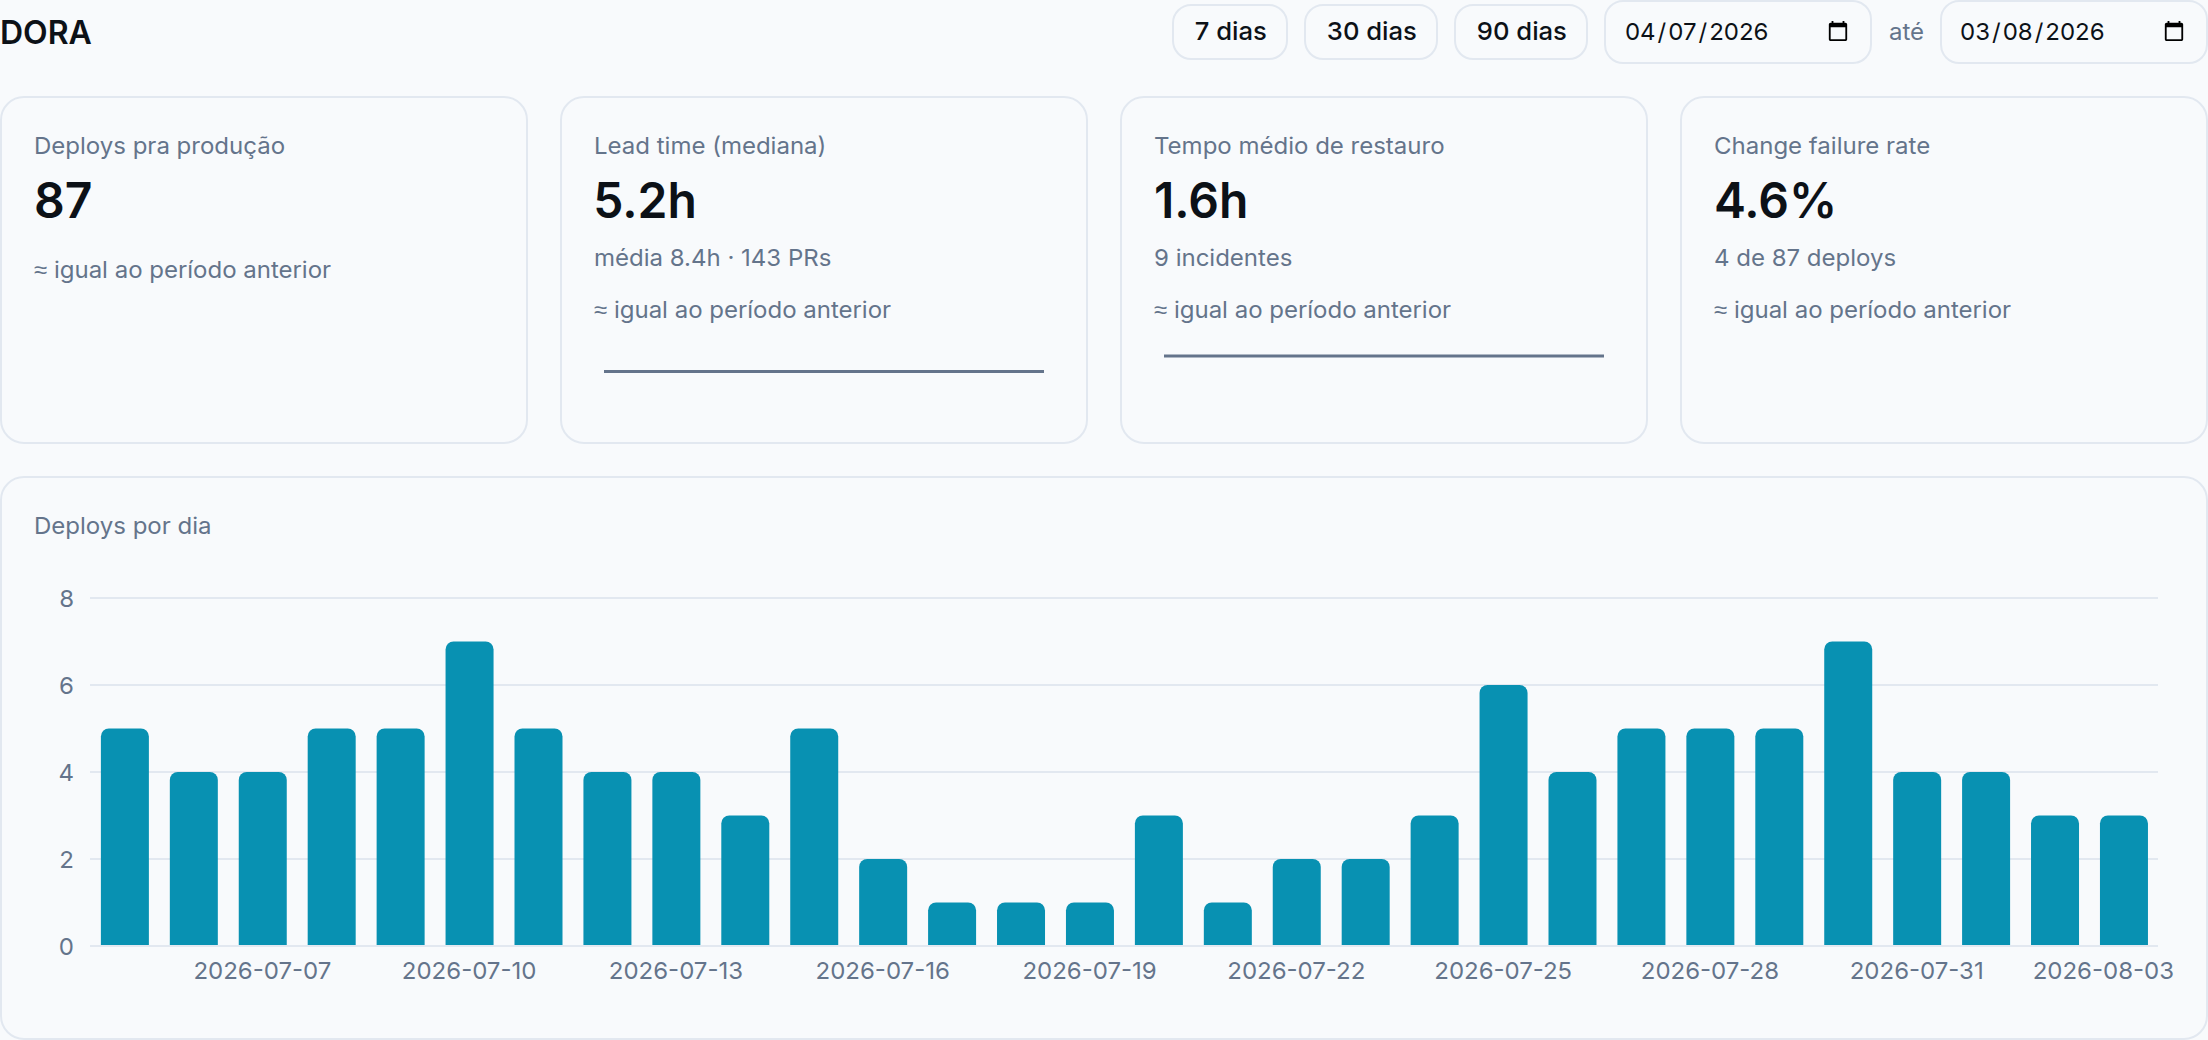
Illustrative data, for demonstration purposes only.
GitHub, GitHub Actions, ArgoCD, Vercel, Azure Pipelines, Waroom and incident.io sync incrementally — manual trigger or once a day on their own.
What counts as a production deploy, and which event starts the lead-time clock, is configurable per team — with a company-wide default as fallback. No CI/CD? Count board transitions instead.
A deploy counts as a failure only when a real incident — classified by your own rules — lands within a configurable window after it, not by guessing from ticket labels.
All four metrics recalculate from that, scoped to one team or the whole org, with a week-by-week trend line — not just today's snapshot.
Nobody's copying deploy counts into a spreadsheet every Friday. The numbers update as your tools sync, automatically.
What counts as a production deploy, or which event starts the lead-time clock, is configurable per team — with a company-wide default as fallback. Teams without a CI/CD pipeline can count board transitions instead.
Change failure rate isn't guessed — a deploy counts as a failure when a real incident, classified by your own rules, lands within a configurable window after it. You can see exactly which config produced the number.
Look at the whole org, or filter to one team — the same four metrics, scoped either way.
Connect more than one CI/CD tool to the same team — GitHub Actions and Vercel, say — and moasy.tech catches the risk of counting the same deploy twice on its own, instead of quietly showing an inflated number.
Manual events you log yourself — a migration, a departure, a deploy freeze — show up right on the trend chart, next to every config change that could also explain a shift in the number. See the full picture on the Timeline feature.
Every DORA card on the dashboard is clickable — it opens a detail view with the individual deploys, PRs or incidents that make up that number, not just the aggregate.
See these four metrics computed from your own data, not a demo.
Get started freeGitHub Actions and Vercel use official, documented REST APIs. ArgoCD and the Azure DevOps integrations (Pipelines, Boards, Repos) exist and sync, but haven't been live-tested against a real account yet — treat early numbers from those with a bit more scrutiny until we can confirm the same track record.
You can count board transitions instead — moving a ticket to "Done", for example — as the deploy signal. Same four metrics, a different source event.
It's tied to deploys, not tickets. A deploy only counts as a failure when a real incident — classified by your own rules — lands within a configurable window after it. Not every bug ticket is a production incident, and not every incident traces back to a deploy.
You can connect it — same incident pipeline behind MTTR and change failure rate. But incident.io doesn't resolve an incident to a specific team yet the way Waroom does, and change failure rate only counts an incident that's linked to a team — so until that catches up, incident.io data syncs but doesn't yet factor into your DORA numbers. Waroom remains the reliable choice for that today.