1:1 prep, not a scoreboard
Work items, PRs merged and reviewed, deploys, incidents and toil hours per person — context for a conversation, explicitly not a ranking.
USE CASE
You're closest to the team — you need the context for 1:1s and staffing calls, not a leaderboard.
The questions an Engineering Manager actually asks are granular: who's underwater this month, who hasn't had a PR reviewed in a while, whose cycle time crept up. The per-contributor breakdown in Capacity & Workload exists for exactly that — built to inform a conversation, not to rank people against each other.
Before a 1:1, you pull up the per-contributor breakdown for that person — work items by category, PRs merged and reviewed, toil hours — a starting point for the conversation, not a scorecard to read off. In standup, WIP and cycle time are already current, so you're not asking "what are you working on" just to fill a status board. And when someone moves teams, their numbers move with them — the same breakdown, just scoped to wherever they land next.
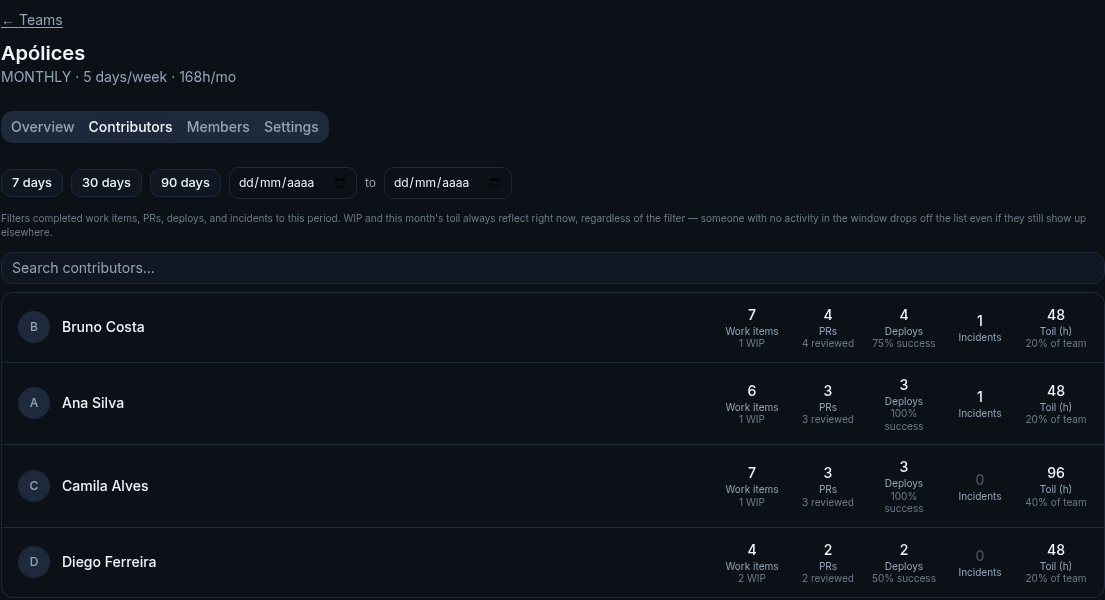
Illustrative data, for demonstration purposes only.
Work items, PRs merged and reviewed, deploys, incidents and toil hours per person — context for a conversation, explicitly not a ranking.
Toil ratio and week-by-week trends catch a team member quietly drowning in Toil before it turns into burnout.
See what's actually in progress right now, and how long things are taking to ship, without asking for a status update.
For people who work across teams, the breakdown follows them — not just their primary team.
See how many items have gone untouched for 30+ days — useful in a planning conversation about what's actually stuck versus what just hasn't started yet.