GUIDE
Flow Distribution: What It Is and How to Calculate It
A core flow metric — the mix of work a team actually completes, broken down by category.
What it measures
Flow distribution is the proportion of completed work that falls into each category your team tracks — commonly some version of feature work, defects/bugs, technical debt, and risk/compliance work. The Flow Framework defines four official categories; in practice, most teams eventually need a fifth or their own variation, because the original four don't cleanly cover work like recurring operational toil that isn't quite a defect and isn't quite a feature.
Why it matters
A single throughput number hides the story flow distribution tells: a team that "shipped 40 items" but where 30 of them were bug fixes is in a very different position than one where 30 were new features. Tracking the split over time turns "we're busy" into "we're spending most of our capacity on defects this quarter" — a starting point for an actual conversation about priorities, not just a vague sense that the team is stretched.
It's also one of the more honest ways to make an investment case that isn't usually visible until it's already a crisis. "We need to pay down technical debt" is easy to deprioritize when it's an opinion; "technical debt has grown from 10% to 30% of our completed work over two quarters, and feature work dropped accordingly" is a trend a roadmap conversation actually has to respond to.
How to calculate it
Classify each completed item into a category, then express each category's share as a percentage of total completed work over a period. The part that requires an actual decision is where the category boundaries sit — issue type and labels in your tracker are a starting point, but rarely line up cleanly on their own; most teams end up needing explicit rules (if field X contains Y, it's category Z) to get a breakdown people actually trust.
A quick example: a team completes 60 items in a month — 12 Bug, 30 Feature, 10 Technical Debt, 6 Toil, 2 Risk. Flow distribution expresses that as shares: 20% Bug, 50% Feature, 17% Technical Debt, 10% Toil, 3% Risk. On its own, a single month's split doesn't say much — the useful signal is watching those shares move (or not) quarter to quarter.
A common trap
Category definitions that drift over time — a rule quietly tightened or loosened without anyone deciding to — make a distribution chart look like priorities shifted when really the measuring stick changed. Treat a change in the rules as a note on the chart itself (moasy.tech's Timeline exists partly for this), not a silent edit, so a real shift in what the team works on isn't confused with a redefinition of what a category means.
How moasy.tech computes it
moasy.tech classifies completed work into Bug, Feature, Technical Debt, Toil and Risk — five categories instead of the Flow Framework's original four, closer to how engineering teams actually describe their work, including a category ("Toil") for the recurring operational load that doesn't fit neatly as a defect or a feature. Categories come from semantic rules you configure yourself, not a fixed taxonomy: set a company-wide default, then let each team override it, since what counts as Toil for one team can be a Feature for another. The same categorization can also be broken down one level further, by epic, to see which specific initiative is generating the most of any given category.
See the other flow metrics in the full guide, or the complete implementation on the Flow Metrics feature page.
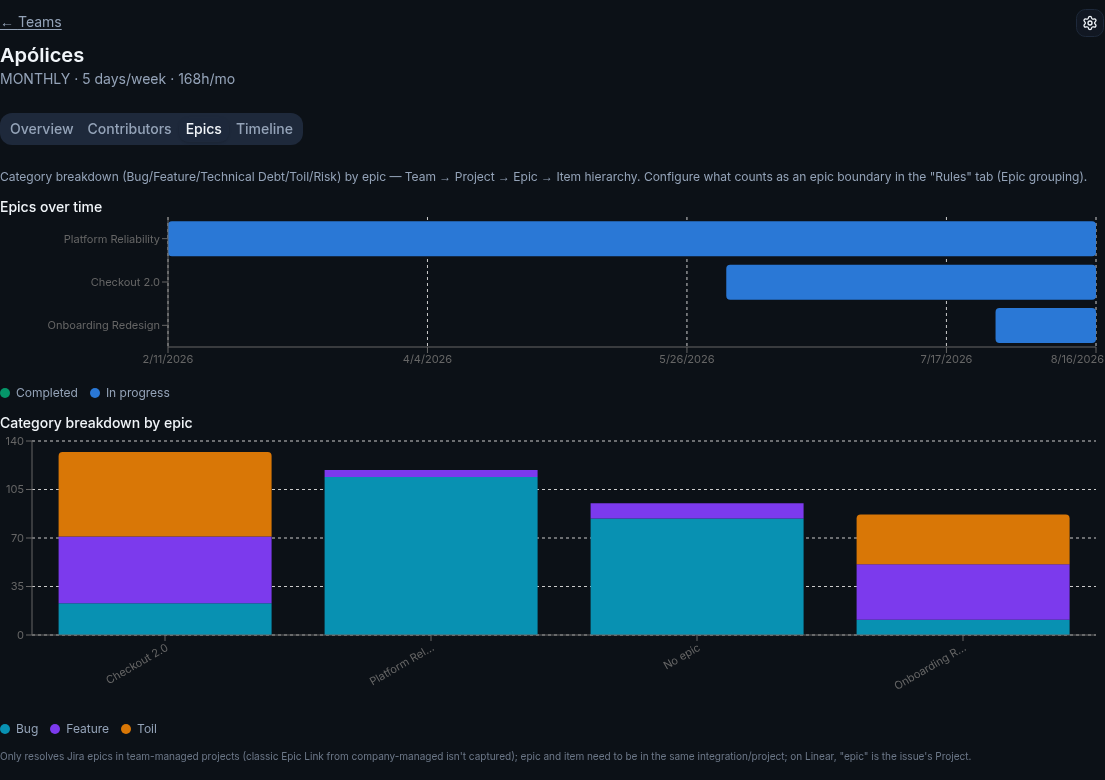
Illustrative data, for demonstration purposes only.
Questions about flow distribution
Why does moasy.tech use 5 categories instead of the Flow Framework's 4?
Because "Toil" — recurring operational work like manual deploys, access requests, or routine maintenance — doesn't map cleanly onto feature, defect, debt or risk, and forcing it into one of those buckets made the breakdown less useful, not more accurate.
Can the same category mean different things on different teams?
Yes, on purpose — a team's own rule takes precedence over a company-wide default, since what one team treats as Toil, another might treat as a Feature, and forcing one fixed definition on every team tends to produce numbers nobody on the ground trusts.
Is there a "healthy" flow distribution split?
Not a universal one — it depends on product maturity and business context (a young product usually skews toward Feature, an older one toward Technical Debt and Toil). What's more useful than a fixed target is the trend: a category climbing steadily quarter over quarter is worth a conversation regardless of what the "right" number would be.
See your own flow distribution
Get started free