GUIDE
Mean Time to Restore: What It Is and How to Calculate It
One of the 4 DORA metrics — how long it takes a team to recover once something breaks in production.
What it measures
Mean time to restore (MTTR) is the average time between an incident starting and it being resolved — from the moment production breaks to the moment it's fixed. Of the 4 DORA metrics, it's the one that answers a different question than the other three: deployment frequency, lead time and change failure rate are all about how you ship; MTTR is about what happens after something goes wrong anyway, because eventually something always does.
Why it matters
No team ships changes with a 0% failure rate forever — production breaks sometimes, no matter how careful the process. What separates a resilient team from a fragile one isn't whether incidents happen, it's how fast the team notices and recovers. A team with a slow MTTR pays for every incident twice: once in the outage itself, and again in the extra hours of firefighting, escalation and manual investigation that a faster team would have skipped. Over a year, the gap between an elite MTTR and a slow one is the difference between incidents being a Tuesday-afternoon inconvenience and each one turning into a multi-day incident review.
MTTR is also the metric that makes shipping faster genuinely safe to pursue. A team that only tracks deployment frequency and change failure rate can still get burned by shipping fast if recovery is slow — more deploys means more chances for an incident, and if each one takes days to resolve, speed stops paying off. Tracking MTTR alongside the other three is what turns "we ship fast" into "we ship fast and recover fast when it matters."
How to calculate it
Take every incident resolved in a period, measure the time between it starting and it being resolved, and average those durations. The two decisions that actually change the number: where the clock starts — the moment the incident was triggered, or the moment someone acknowledged it — and where it stops, usually when the incident is marked resolved, not when a permanent fix ships (a rollback that restores service counts, even if the underlying bug isn't patched yet).
A quick example: a team resolves 6 incidents in a month, with restore times of 0.5h, 1h, 1h, 2h, 4h and 40h — one long outage. The average is 8.1 hours, dragged up almost entirely by that one incident. The median (the middle value, 1.5h) tells a very different story: most incidents get resolved fast, and one outlier is skewing the mean. Both numbers are useful — average shows total impact, median shows what a typical incident actually looks like — which is why it's worth checking both rather than picking one.
Elite vs. typical performance
DORA's research groups teams into rough tiers here too. Elite performers restore service in under an hour, typically. Teams in the middle tend to take somewhere between a day and a week. Lower performers can take longer than a week. As with the other 3 metrics, treat these as a general sense of where a team sits rather than a strict scorecard — the exact bands have shifted slightly across different years of the State of DevOps Report, and a single very long outage can swing an average without meaning the team's typical recovery actually got worse.
A common trap
The fastest way to make MTTR look better without actually getting better at recovering is to start the clock late — measuring from acknowledgement instead of from when the incident actually began. That can be a legitimate choice (some teams genuinely can't detect an incident before someone notices it), but it's worth being honest about which one you're measuring: "time to acknowledge and fix" and "time from first impact to fix" are different numbers, and only the second one reflects what your users actually experienced.
How moasy.tech computes it
moasy.tech recalculates MTTR automatically from incidents synced read-only from Waroom or incident.io — no manual timing, no spreadsheet. Which timestamp starts the clock is configurable per team (incident trigger by default, or acknowledgement instead), with a company-wide default as fallback, so the choice is explicit instead of buried in a formula nobody remembers deciding. Both the average and the median restore time are shown side by side, with a trend line, so one bad outage doesn't quietly hide behind a single number.
See the other 3 DORA metrics in the full guide, or the complete implementation on the DORA Metrics feature page.
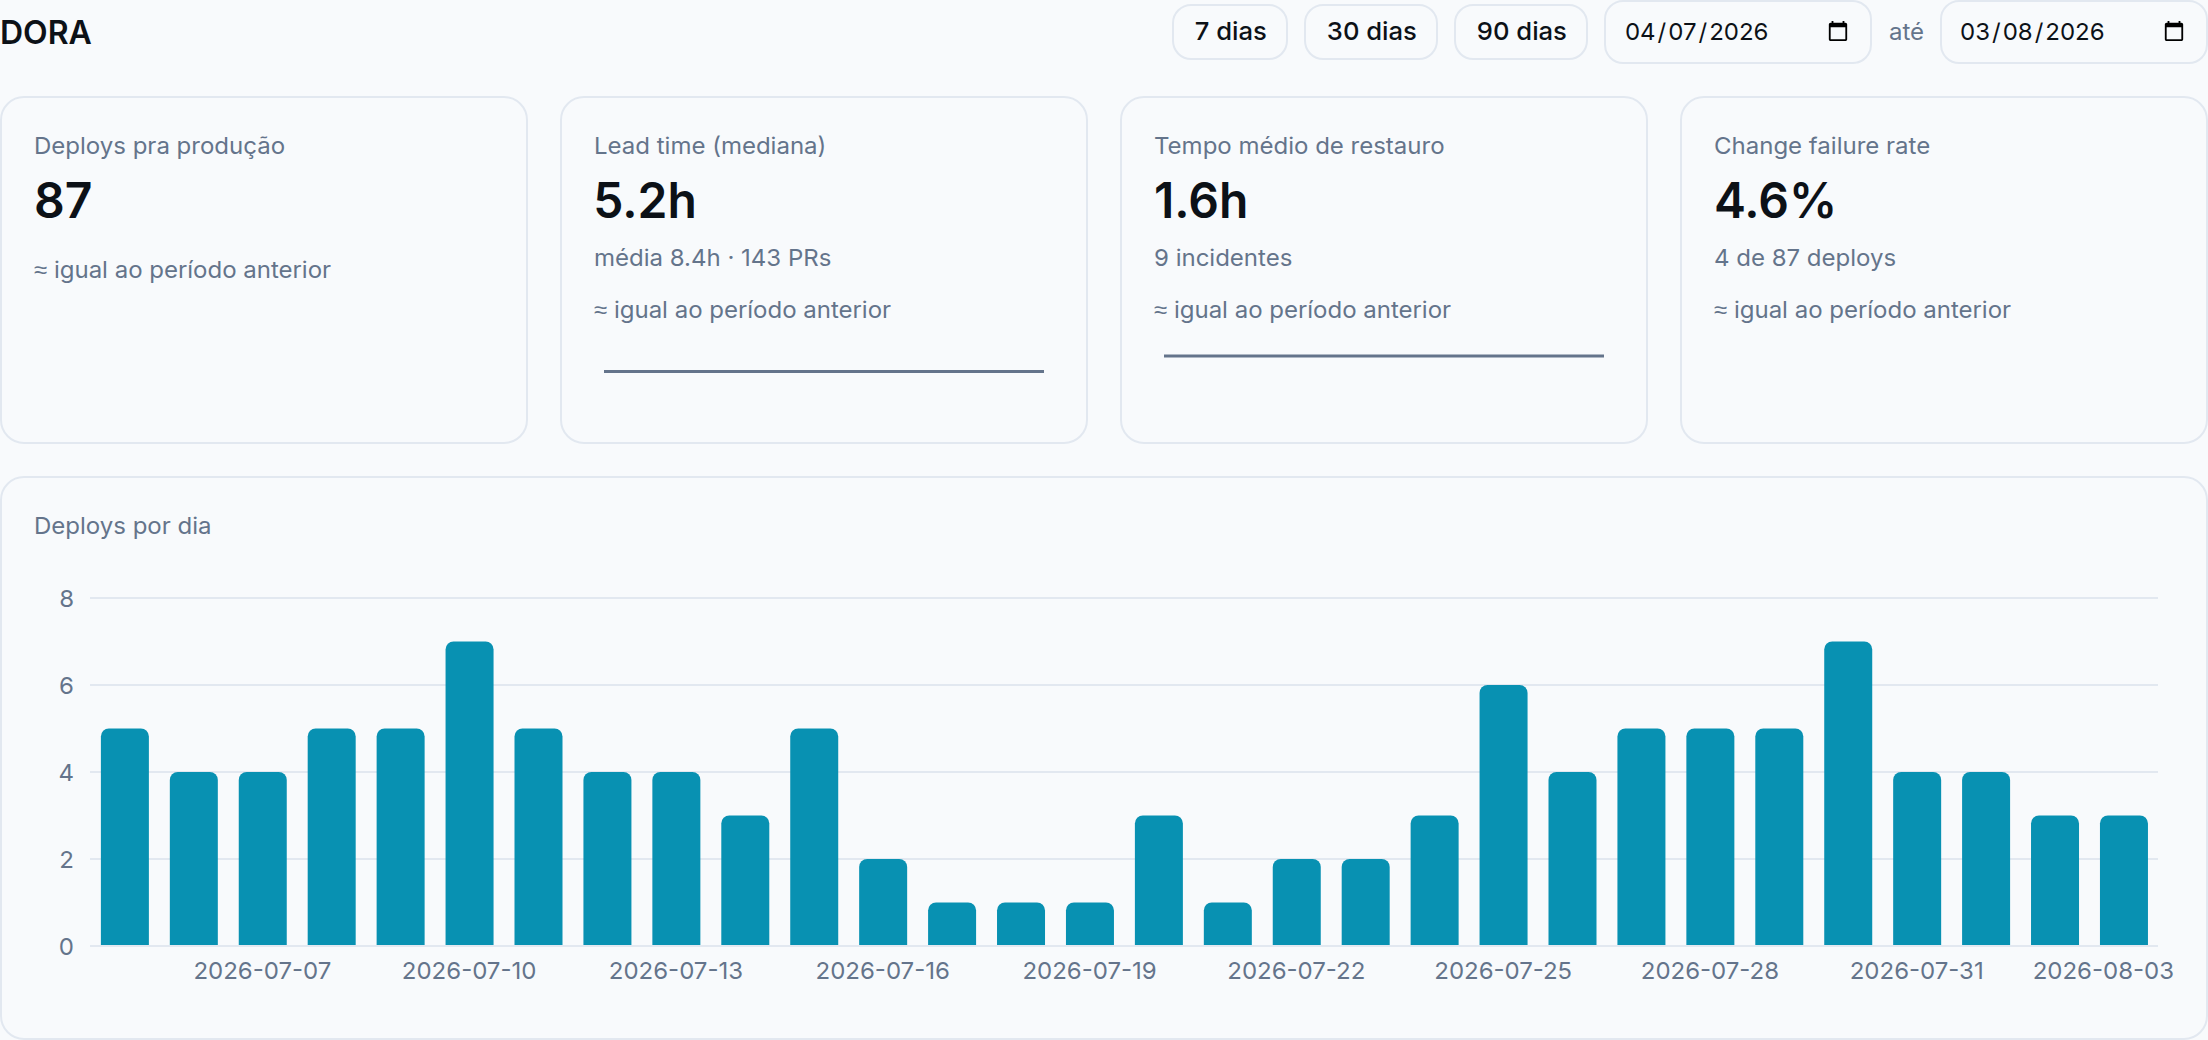
Illustrative data, for demonstration purposes only.
Questions about mean time to restore
Does MTTR only count incidents caused by a deploy?
No — MTTR counts every resolved incident in the period, whether or not it traces back to a recent deploy. Change failure rate is the metric that specifically ties incidents to deploys; MTTR is about recovery speed in general.
What if an incident is reopened after being marked resolved?
Only incidents with a resolved timestamp in the period are counted — if a fix doesn't actually hold and the incident reopens, that's typically a new incident record in Waroom/incident.io with its own restore time, not a retroactive edit to the first one.
Why do average and median MTTR sometimes look so different?
One very long outage pulls the average up a lot without changing what a typical incident looks like — the median is more resistant to that. Watching both is more honest than picking whichever number looks better.
See your own mean time to restore
Get started free