GUIDE
Cost Classification: CapEx vs. OpEx Explained
What software capitalization actually means for an engineering team, and why the split between CapEx and OpEx is more than an accounting formality.
What it measures
Cost classification splits completed engineering work into two accounting categories: CapEx (capital expenditure — work that creates or substantially improves an asset, capitalized on the balance sheet and depreciated over time) and OpEx (operating expenditure — work that keeps the lights on, expensed immediately). A third bucket, unclassified, covers anything that hasn't been assigned a rule yet — deliberately never hidden, since silently defaulting unclassified work into either bucket would misstate the split.
Why it matters
This isn't an engineering metric that happens to have a finance-sounding name — it's a real input to how a company reports its financials. Capitalized engineering cost becomes an asset that depreciates over years instead of a cost that hits the current quarter's expenses all at once, which directly affects reported earnings, and in some jurisdictions, eligibility for R&D tax credits. Finance teams have needed this split for as long as software has existed; what's usually missing is a reliable, low-effort way to produce it that doesn't depend on engineers manually tagging their own tickets months after the fact, from memory.
It also matters for a second, more everyday reason: a live CapEx/OpEx breakdown is one of the clearest ways to see how much of engineering's output goes toward building new things versus keeping existing things running — a question CTOs and CFOs both care about, for different reasons, and one that's genuinely hard to answer without this kind of classification in place.
How to calculate it
Classify each completed item (not backlog items — only work that's actually shipped) into CapEx,
OpEx, or leave it unclassified, based on rules mapped from the same semantic categories used
elsewhere (Feature work commonly maps to CapEx, Bug fixes and Toil commonly map to OpEx, though
the exact mapping is a policy decision, not a fixed rule). Alongside the count of items in each
bucket, hours — elapsed time from when work started to when it finished — gives a
rough sense of scale, though it's worth being explicit that elapsed time isn't the same as
tracked effort: an item blocked for a week waiting on review counts that week the same as if
someone had been actively working on it the whole time.
A quick example: a team completes 20 items in a month — 16 map to CapEx, 4 to OpEx, none unclassified. The split is 80% CapEx, 20% OpEx by count. If those items also carry 1,395 elapsed hours between them, the same split can be expressed in hours instead of item count — useful for a finance conversation, since dollar impact tends to track hours more closely than raw item count.
How to interpret the numbers
There's no universal "correct" CapEx/OpEx ratio — it depends entirely on a company's own capitalization policy (which is itself a legitimate, sometimes conservative, accounting choice) and on what stage of building a product a team is in. A team in heavy new-feature development will naturally skew CapEx-heavy; a team mostly doing maintenance and bug fixes on a mature product will skew OpEx-heavy, and that's not a problem to fix, it's just what maintenance work looks like. What's worth watching instead of chasing a target ratio: a growing unclassified bucket, which usually means new work is shipping faster than someone is updating the classification rules for it.
A common trap
Cancelled work — an item started, then abandoned before completion — quietly inflating "delivered" totals is a real failure mode, not a hypothetical one: an item that sits cancelled for months can end up counted as done in a system that doesn't track cancellation as its own state, overstating both the CapEx/OpEx totals and anything else that assumes "completed" means "delivered." Treating cancelled work as a separate, visible category — instead of quietly folding it into whichever bucket it happened to be in when someone gave up on it — avoids that distortion.
How moasy.tech computes it
moasy.tech classifies every completed item into CapEx, OpEx or unclassified using semantic rules you configure — the same rule engine used for Bug/Feature/Technical Debt/Toil/Risk classification elsewhere, so cost classification stays consistent with how the team already categorizes its work instead of requiring a second, separate taxonomy. Reclassifying a category (say, moving Technical Debt from OpEx to CapEx) reflects immediately across the dashboard, without needing a resync — it's a live view of a policy decision, not a report generated once and left stale. Cancelled work is tracked as its own signal, kept separate from the CapEx/OpEx/unclassified totals so it never quietly counts as delivered.
See the complete implementation on the Cost Classification feature page, or the step-by-step for setting up the classification rule in the Help tutorial.
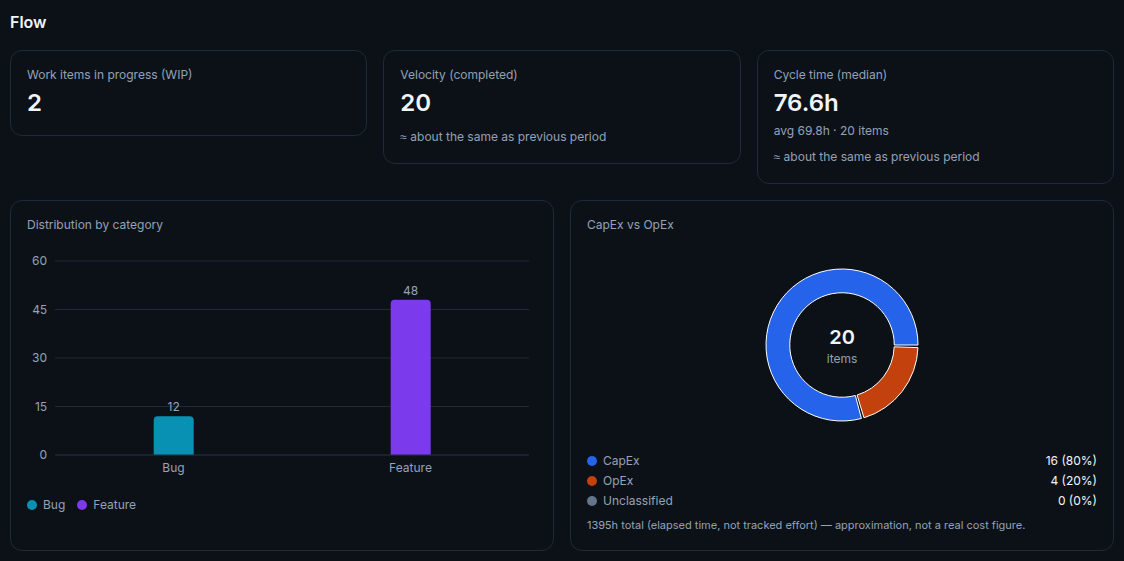
Illustrative data, for demonstration purposes only.
Questions about cost classification
Does this replace real time tracking or accounting software?
No — it's a live signal for engineering leadership and finance to work from, based on elapsed time and configurable rules, not a system of record for actual effort or cost. Treat the hours figure as an approximation, not a real cost number, especially if it's feeding a formal accounting decision.
What happens to items that don't match any rule?
They show up in the unclassified bucket, always visible rather than silently defaulted into CapEx or OpEx — it's a signal that a category needs a rule configured, not an error to work around.
Why track cancelled work separately instead of just excluding it?
Because "how much work gets abandoned" is itself a useful signal (about scoping, about churn), distinct from "how much delivered work is CapEx vs. OpEx." Folding it into either question would make both answers less accurate.
See your own CapEx/OpEx split
Get started free