GUIDE
Change Failure Rate: What It Is and How to Calculate It
One of the 4 DORA metrics — the share of deploys that end up causing an incident.
What it measures
Change failure rate is the percentage of deploys to production that result in a degraded service, an outage, or any other incident requiring remediation. It's the metric that keeps the other three honest — deployment frequency and lead time reward speed, and change failure rate is the check that speed isn't coming at the cost of stability.
Why it matters
Deployment frequency and lead time can both be improved by cutting corners — skip review, skip tests, ship anyway. Change failure rate is the number that exposes whether that's what actually happened. A team can look excellent on the other 3 DORA metrics while quietly accumulating outages, and change failure rate is the one figure that would catch it. It's also the metric most directly tied to what users experience: they rarely notice how often you deploy, but they absolutely notice when a deploy breaks something they were using.
It matters for a second reason, less obvious: a high change failure rate is expensive in a way that compounds. Every failed deploy doesn't just cost the incident itself — it also tends to slow the team down afterward, as people get more cautious, add more manual checks, and batch changes more conservatively to avoid the next one. A team that keeps its failure rate low can afford to move fast with confidence; one that doesn't ends up paying for speed with caution later.
How to calculate it
Divide the number of deploys that caused an incident by the total number of deploys over the same period, expressed as a percentage. The part that actually requires a decision is what counts as "caused" — the cleanest approach is to only count an incident that started within a defined window after a deploy (an hour, for instance), so unrelated problems that happen to occur around the same time don't inflate the number.
A quick example: a team ships 50 deploys in a month, and 3 of them are followed by an incident within the configured window. Change failure rate for the month is 3 ÷ 50 = 6%. That's the whole calculation — the work is entirely in deciding, ahead of time, what "caused" and what "within the window" mean, so the number means the same thing every month instead of shifting definitions quietly.
Elite vs. typical performance
DORA's research has consistently found elite and high performers cluster in a low range — well under a third of deploys causing a failure, often much lower — while lower performers sit meaningfully higher. Treat the exact cutoffs as a general sense of scale rather than a strict scorecard, since the precise bands have shifted slightly across different years of the State of DevOps Report.
A common trap
A narrow correlation window makes change failure rate look better without deploys actually getting safer — an incident that surfaces 90 minutes after a deploy, just past a 1-hour window, still traces back to that deploy even if the metric doesn't catch it. There's a real tradeoff here (too wide a window starts blaming deploys for unrelated problems), but it's worth revisiting the window occasionally rather than treating whatever value was picked first as permanent.
How moasy.tech computes it
moasy.tech ties change failure rate directly to incidents, not to guesswork from ticket labels. A deploy only counts as a failure when a real incident — synced read-only from Waroom or incident.io and classified by your own configurable rules (team override, with a company-wide default as fallback) — lands within a configurable window after it. incident.io doesn't yet resolve an incident to a specific team the way Waroom does, and change failure rate requires a team-linked incident, so incident.io data syncs but doesn't factor into this number until that catches up.
See the other 3 DORA metrics in the full guide, or the complete implementation on the DORA Metrics feature page.
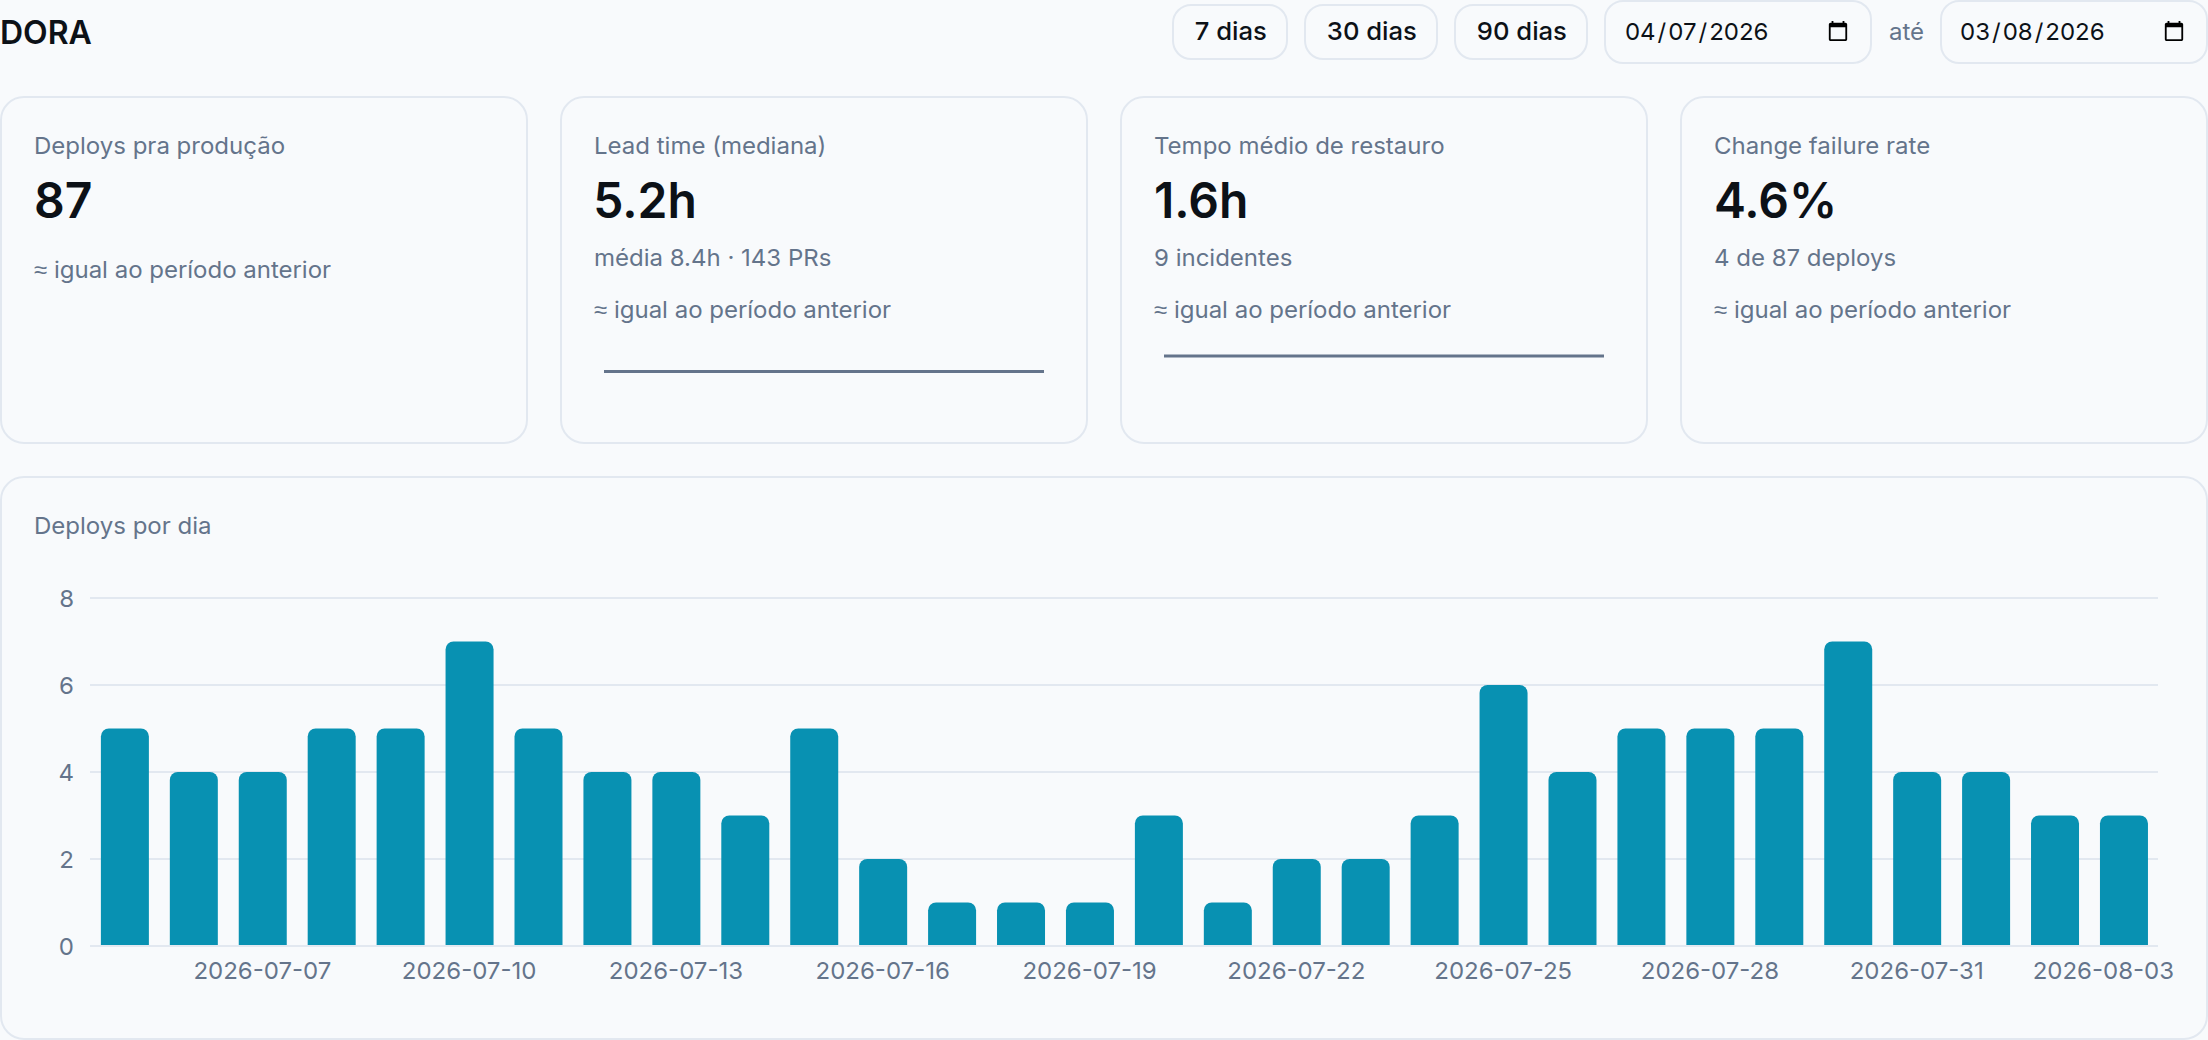
Illustrative data, for demonstration purposes only.
Questions about change failure rate
Is change failure rate the same as counting bug tickets?
No — it's tied to deploys, not tickets. A deploy only counts as a failure when a real incident lands within a window after it. Not every bug ticket is a production incident, and not every incident traces back to a deploy.
What counts as an "incident" for this metric?
That's configurable, not fixed — severity classification rules (which incidents count as a real failure versus purely informational) can be set per team, with an org-wide default as a fallback, since what one team treats as a real incident can differ from another's threshold.
Is this the same as deployment success rate?
No — deployment success rate looks at deploy status alone (did the pipeline itself succeed or fail), with no link to incidents at all. Change failure rate is specifically about deploys that reached production successfully but caused a real incident afterward — a deploy can succeed by that first measure and still count as a failure by this one.
See your own change failure rate
Get started free