✓Computed, not generated
Every number on your dashboard comes from a direct calculation over your synced data — not a model's best guess at what the answer might be.
Engineering Governance
DORA and Flow Metrics, calculated straight from what you already sync from Jira, Linear, GitHub and CI/CD — no LLM in the loop, no token bill at the end of the month.
Get started freeDeployment counts, lead time, cycle time — these are facts sitting in your Jira, GitHub and CI/CD data already. Running them through a language model adds cost and doubt where neither is needed.
Every number on your dashboard comes from a direct calculation over your synced data — not a model's best guess at what the answer might be.
One predictable subscription price. You never pay per report, per query, or per seat of AI usage — because there isn't any.
A deploy count is a deploy count. There's no inference step that can misremember, round creatively, or make something up.
Metrics render as fast as a database query — not as fast as an API round-trip to a language model.
None of this means AI is bad — it just isn't the right tool for "what's my deployment frequency this month." That's a query, not a guess.
| AI-based tool | moasy.tech | |
|---|---|---|
| Where the number comes from | ✕ Model inference | ✓ Direct calculation |
| Cost | ✕ Per token/query | ✓ Flat subscription |
| Reliability | ✕ Can hallucinate | ✓ Same input, same output |
| Speed | ✕ API round-trip to a model | ✓ As fast as a database query |
Four things that today, without this, live scattered across provider dashboards, spreadsheets and whoever happens to be paying close attention.
Deployment frequency, lead time for changes, mean time to restore and change failure rate — recalculated automatically from what's already synced from GitHub, GitHub Actions, ArgoCD, Vercel, Azure Pipelines, Waroom and incident.io. Connect more than one CI/CD tool for the same team (say, GitHub Actions and Vercel) and moasy.tech catches the risk of double-counting the same deploy on its own, instead of showing a number that might be wrong. What counts as an incident — and whether it counts as a failure — follows the same team-configurable rules described below, with a company-wide default as fallback. Filter by date range or by team, with a trend line next to every number — and a timeline of manual events and config changes right alongside it, so a dip always has a nearby explanation. Click any number to drill into the individual deploys, PRs or incidents behind it.
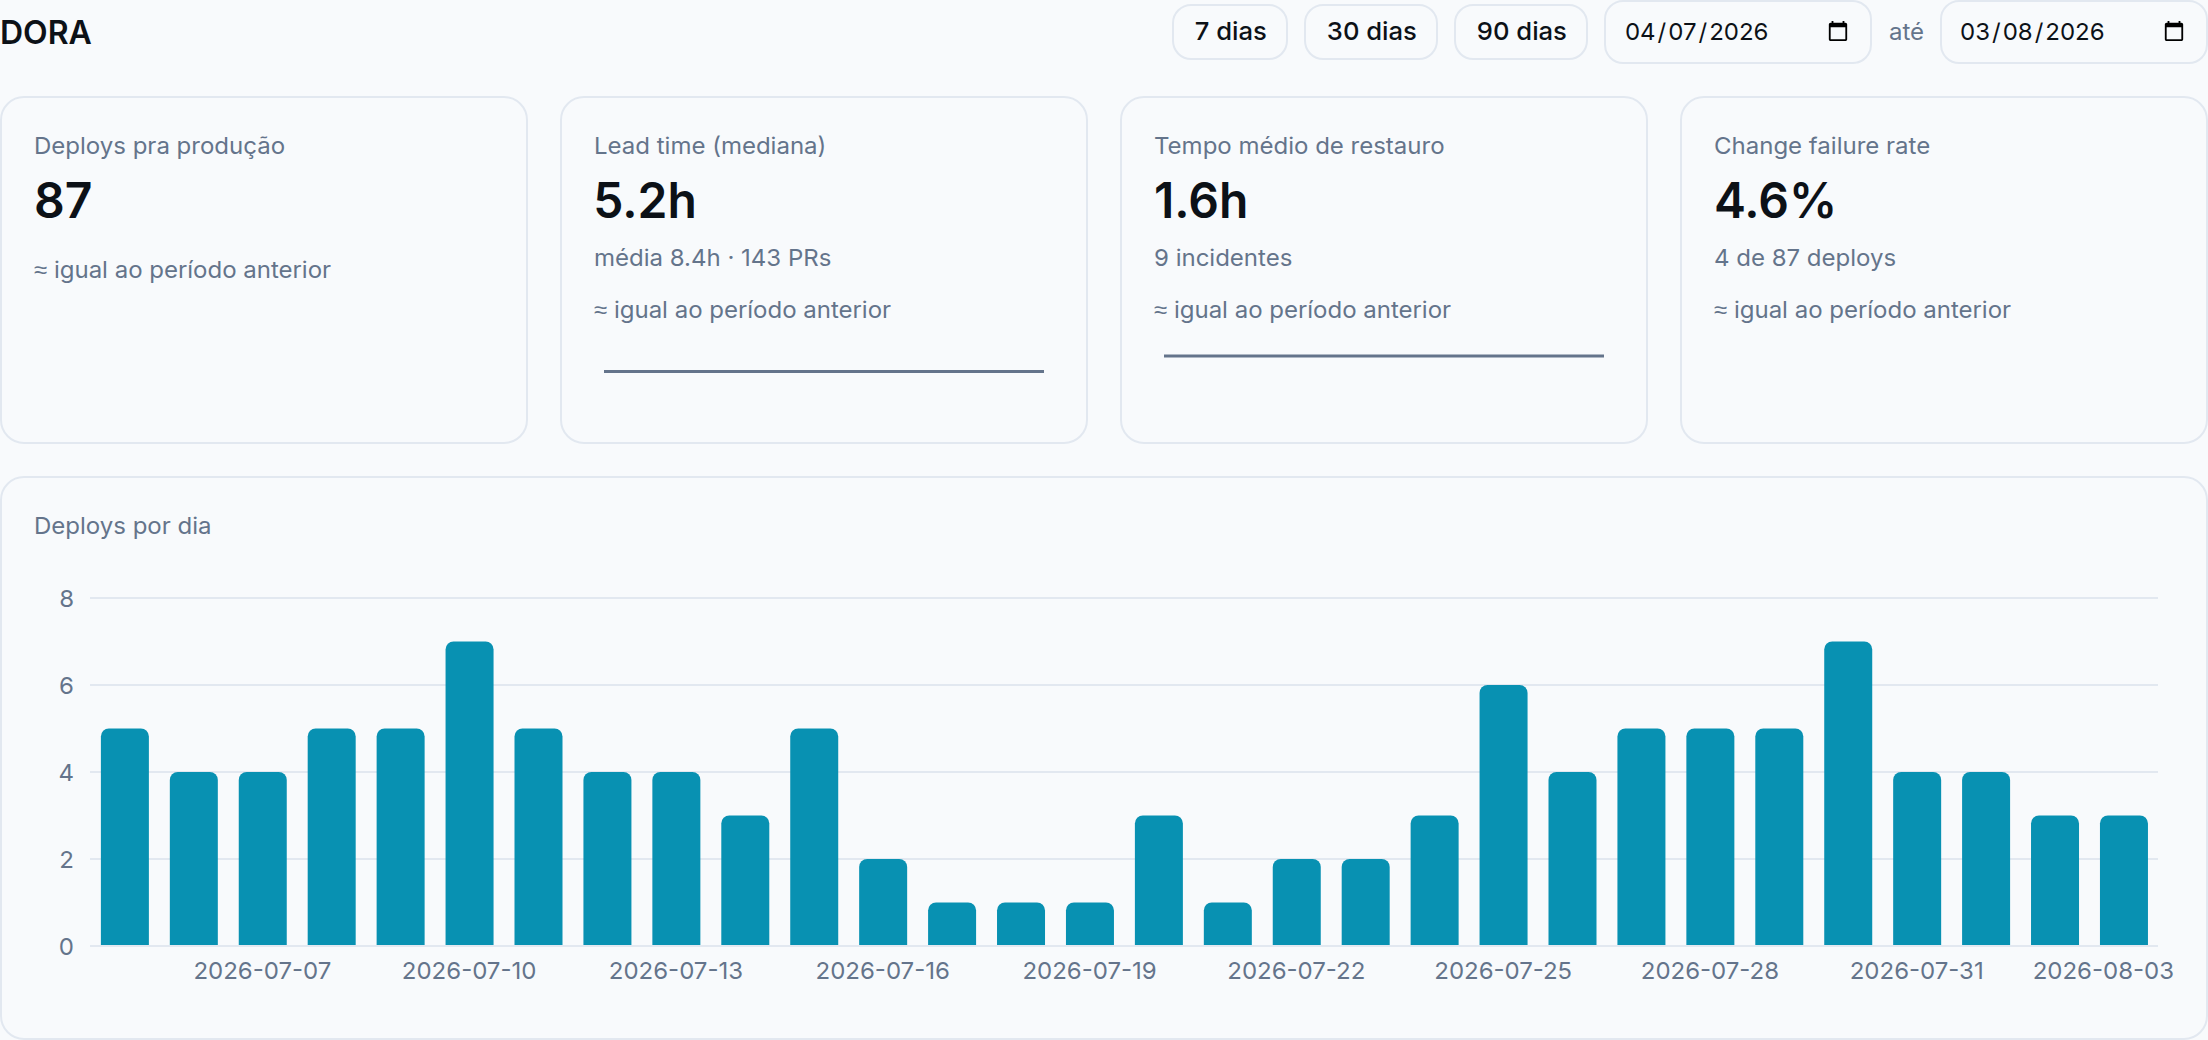
Illustrative data, for demonstration purposes only.
How much got done each week, and how long each category of work takes from start to finish — Bug, Feature, Technical Debt, Toil and Risk, classified by rules you configure yourself. Set a default at the company level, then let each team override it — what counts as Toil for one team can be a Feature for another, and the system adapts instead of forcing one definition on everyone. See the team improving (or not) week over week, not just a snapshot of today. Break the same categories down further by epic — Team → Project → Epic → Item — to see which initiative is actually eating the Toil. Backlog health adds two more numbers: how much of the backlog has gone stale, and how many weeks it represents at your current pace. Click any number to drill into the individual work items behind it.
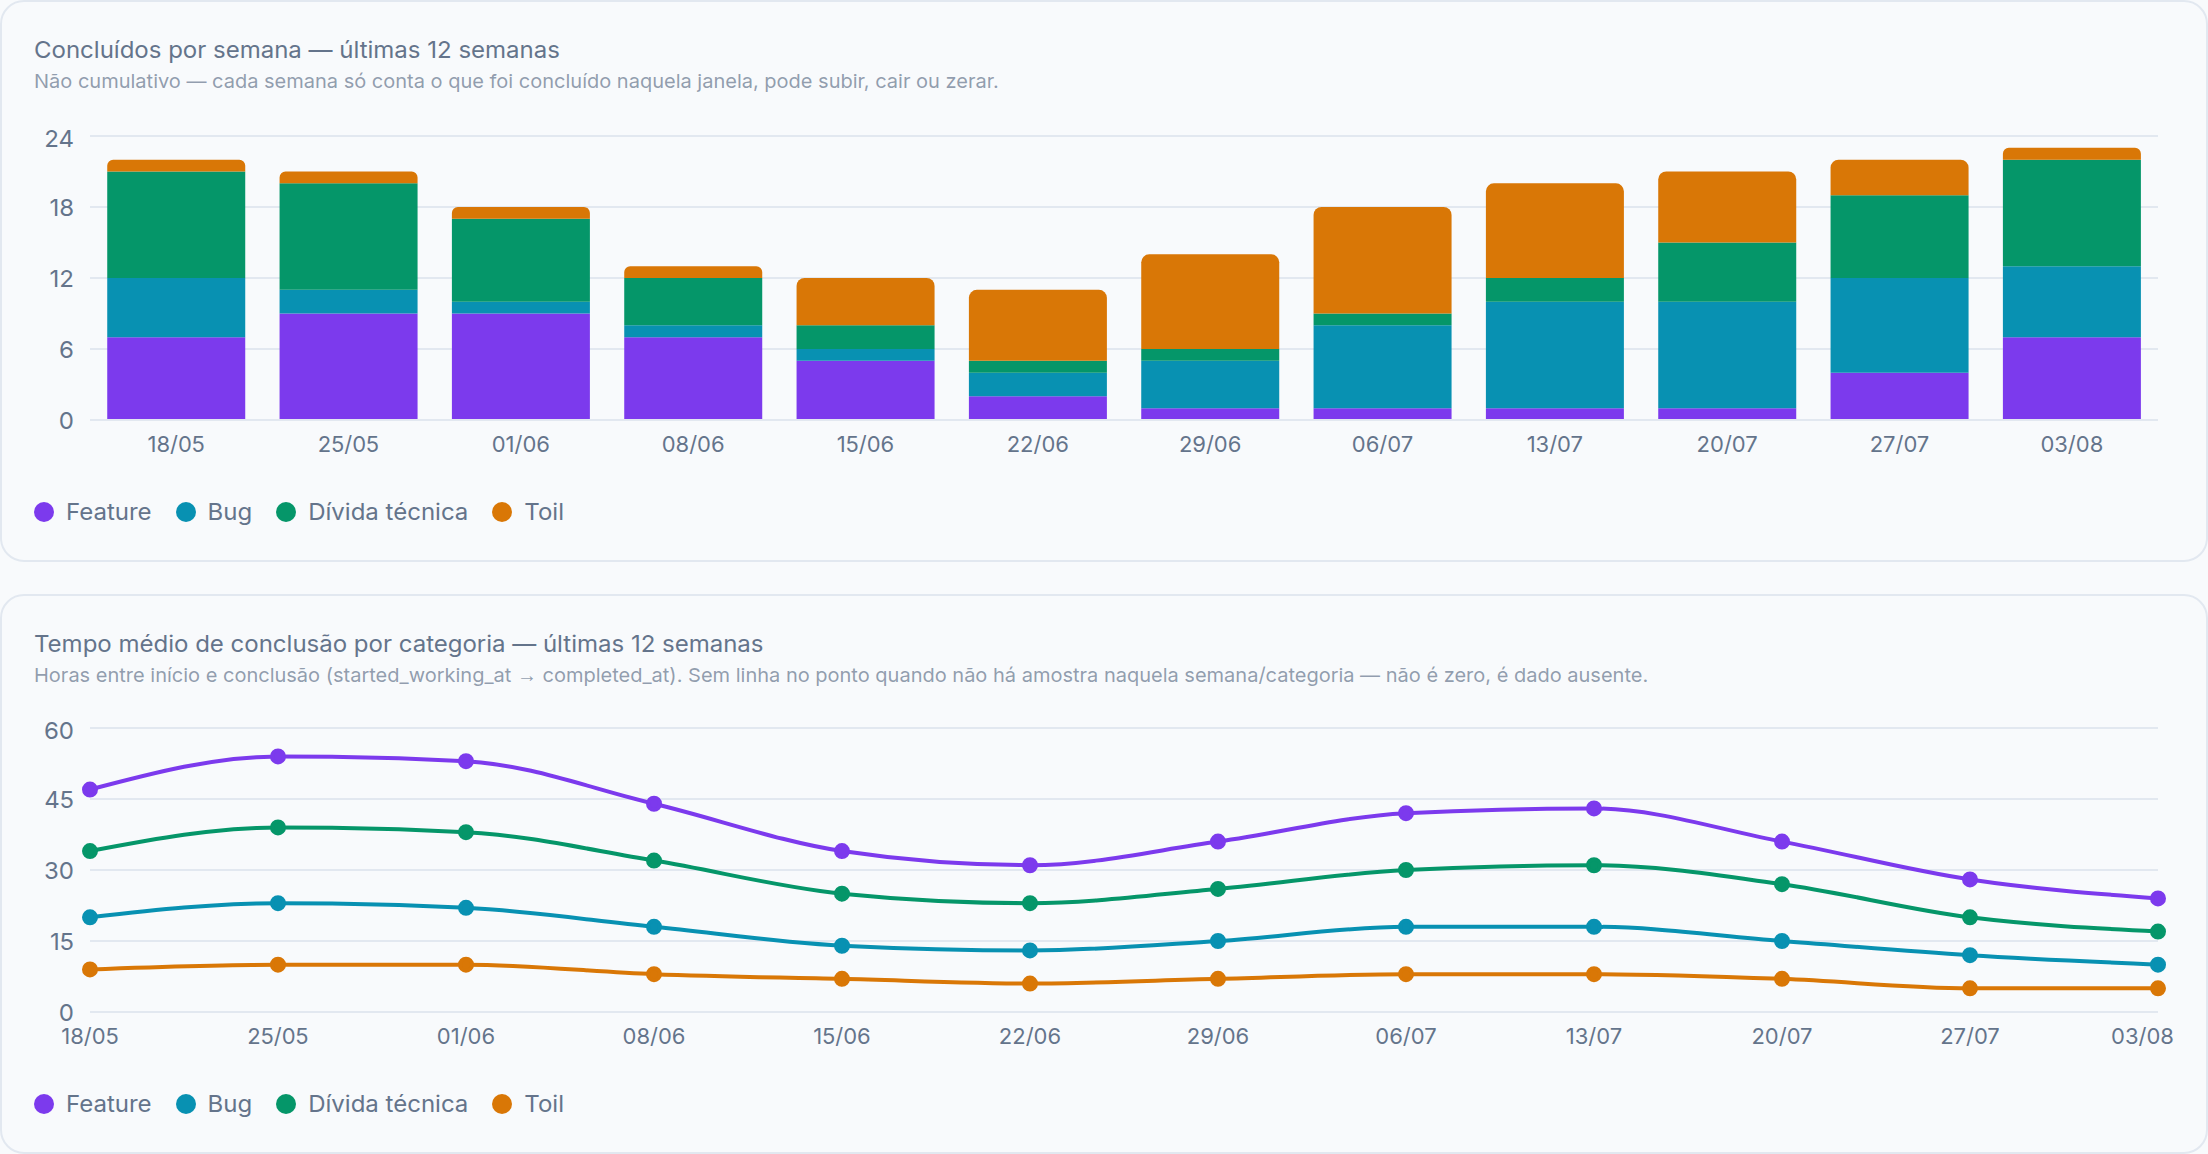
Illustrative data, for demonstration purposes only.
Nothing to migrate: every integration just reads what already exists in your tools. A single provider can have several integrations — two Jira boards, one per team, for example — and each one shows a run history, so you know exactly when it last synced. Azure DevOps is three independent connectors (Boards, Repos, Pipelines), so you only connect the parts your team actually uses. If a sync goes stale or a credential needs reconnecting, you get an in-app alert right away — you don't find out three weeks later that a dashboard's been running on old data.
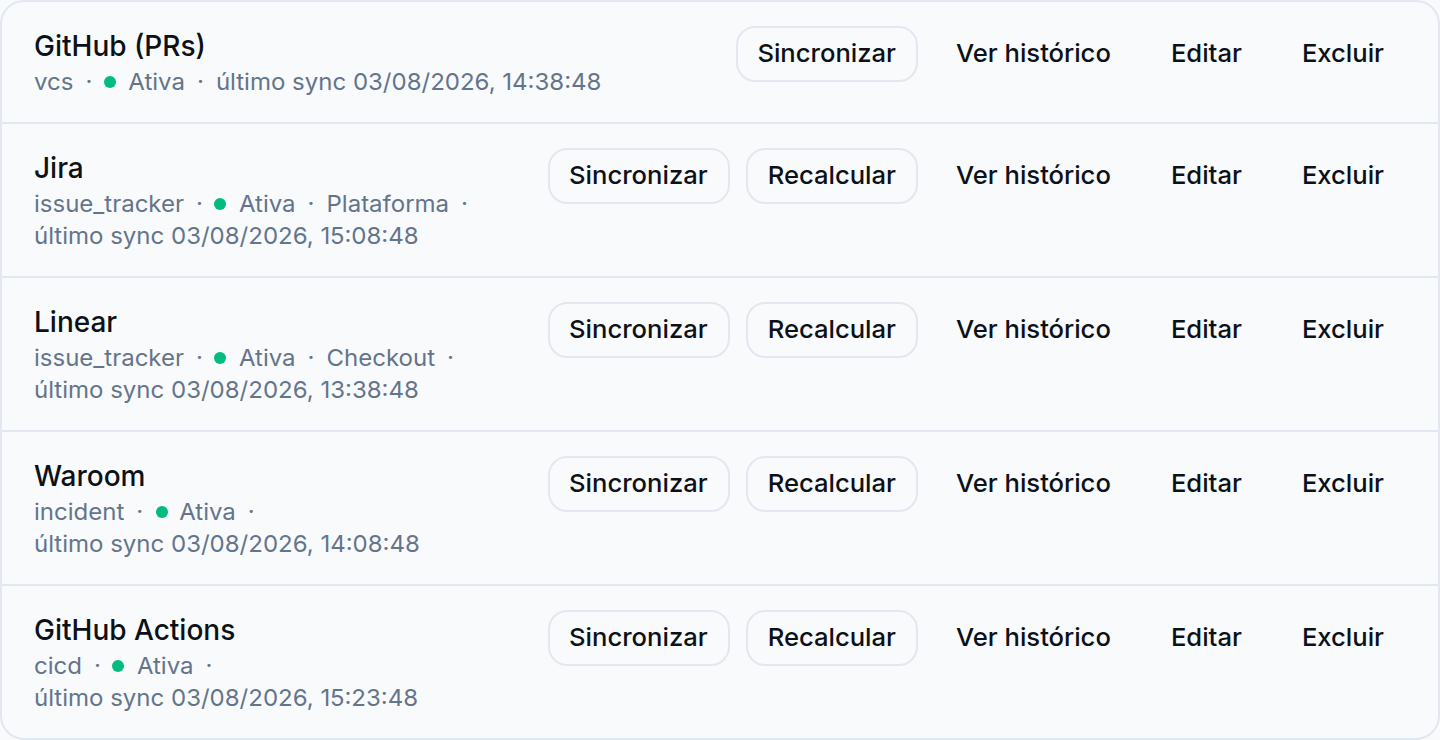
Illustrative data, for demonstration purposes only.
Every team profile pairs its roster and monthly capacity with a toil ratio — hours logged as Toil against the capacity available that month, not just a headcount. Drill down further and see the same breakdown per contributor: work items completed by category, pull requests merged and reviewed, deploys triggered (with success rate) and incidents handled — for one person, across every team they touch, not just their primary team. Every number comes with a week-by-week trend, so you see whether the load is easing or piling up, not just where it stands today.
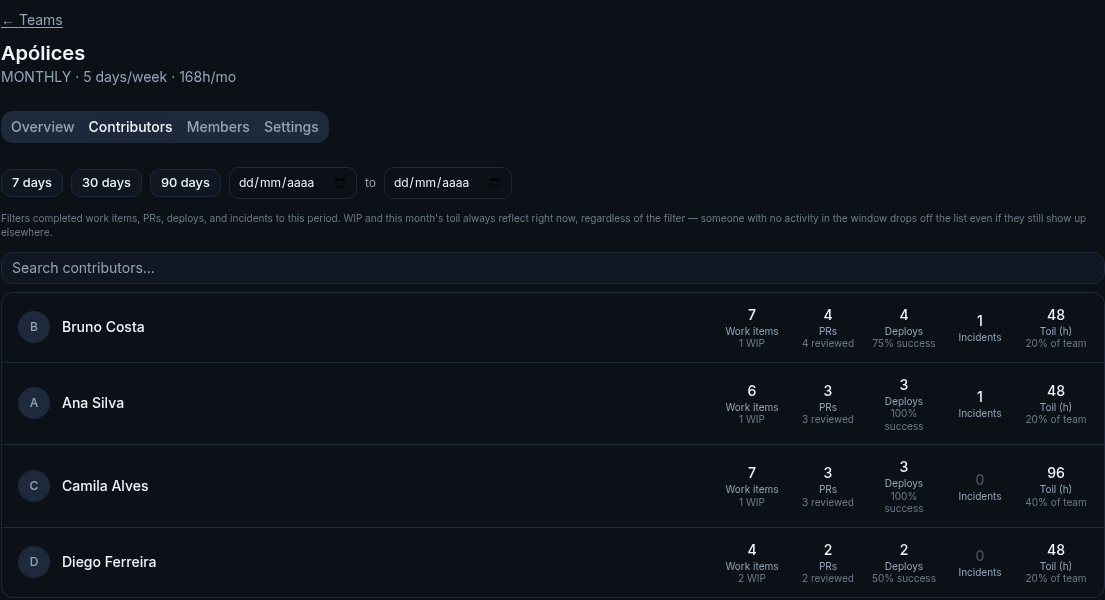
Illustrative data, for demonstration purposes only.
No feature gating — every plan gets the full product, DORA and Flow Metrics included. What changes is how much room you get: users, teams and integrations.
USD 0/mo
Start now, no credit card required.
USD 19.90/mo
30 days free, no credit card required, then USD 19.90/mo.
USD 49.90/mo
30 days free, no credit card required, then USD 49.90/mo.
Custom
Talk to us about your team's specific needs.
No. Every integration is read-only — moasy.tech only reads what already exists in your tools. Sync runs incrementally, either triggered manually or once a day on its own.
Through semantic rules you configure yourself — not an automatic label lookup, and not AI. Rules can be set company-wide and overridden per team, since what counts as Toil or a failure can differ from one team to the next.
Yes. A single provider can have several integrations — two Jira boards, one per team, for example — each syncing and enriching independently.
No, on any plan. The Free plan never touches billing at all. Basic and Pro start with a 30-day trial that doesn't ask for a card either — if you never add one, the trial ends and the subscription cancels on its own, you're never charged without a card on file. You'll get an in-app heads-up about 3 days before the trial ends either way, in case you want to add a card to keep going.
Nothing breaks silently. Adding another one past the limit is blocked with a clear error, and you get an in-app alert either way — every plan gets the same product, the limit is just how much room you have.
No. Cancellation is scheduled, not immediate — you keep access until the end of the period you already paid for.
We validate every credential against the provider before saving it. A bad token fails clearly, on the spot — it never gets saved and silently breaks a sync later.
GitHub, Google, Microsoft or Slack — pick whichever your team already uses, no separate password to create or remember.
No. Every tenant's data is isolated — there's no cross-tenant visibility.
You won't get a silently doubled number. If a team has, say, both GitHub Actions and Vercel connected with production deploys registered, moasy.tech detects that the same deploy might be counted twice and shows deployment frequency as unavailable until you pick which provider counts — a one-time config, not a recurring cleanup.
Sign in with GitHub, Google, Microsoft or Slack.