GUIDE
Toil Ratio: What It Measures and Why It Matters
The share of a team's monthly capacity spent on recurring operational work — the number that tells you whether "we're too busy to ship" is a scheduling problem or a toil problem.
What it measures
Toil ratio divides hours logged against work classified as Toil by a team's total capacity for the current month, expressed as a percentage. The term comes from Google's Site Reliability Engineering practice: manual, repetitive, automatable operational work that scales with the system rather than shrinking as the team gets better at it — think manual deploy babysitting, recurring access requests, repetitive on-call cleanup. It's scoped to the current month on purpose, month-to-date against that month's full capacity, so a team can watch toil accumulate in real time instead of finding out at month's end.
Why it matters
"We don't have time to work on the roadmap" is one of the most common complaints an engineering leader hears, and it's almost never followed by a number. Toil ratio turns that complaint into evidence: if a team is spending 35% of its capacity on Toil, that's over a third of the month gone before any planned feature work starts, and it's a number a leader can act on — automate the recurring task, add headcount, or accept the tradeoff explicitly — instead of guessing whether the complaint is real or just a bad week. Left unmeasured, toil has a habit of growing quietly: each new manual workaround feels small in isolation, and the team adjusts its own expectations downward without anyone deciding that was the right call.
How to calculate it
Classify completed work items by category (the same semantic rules used for Bug/Feature/Technical Debt/Toil/Risk elsewhere), sum the elapsed hours on everything tagged Toil for the current month, and divide by the team's total monthly capacity — the roster's combined hours, with any per-person overrides and allocation percentages applied.
A worked example: a 5-person team with a default 160-hour monthly capacity per person has 800 hours of total capacity. If 180 of those hours land in items classified as Toil, the toil ratio is 180 / 800 = 22.5%. Early in the month, before much work has been completed at all, this number naturally reads low even on a toil-heavy team — that's expected behavior, not a sign toil isn't a problem yet.
How to interpret the numbers
There's no universal "healthy" toil ratio the way DORA metrics have published elite/typical bands — the right number depends heavily on the system's maturity (a legacy platform with manual runbooks will always carry more toil than a newly built one) and on how aggressively a team automates as it goes. What's worth watching isn't a target percentage, it's the trend: a toil ratio that keeps climbing month over month, with nothing planned to bring it back down, is the signal worth a conversation — not any single month's number in isolation.
A common trap
Toil is easy to under-classify because a lot of it doesn't look like "a ticket" — it's a Slack message asking someone to manually re-run a job, or 20 minutes spent granting an access request that never got turned into a tracked item at all. If toil work isn't tracked as a work item in the first place, it can't be classified as Toil, and the ratio quietly understates the real problem. The fix isn't a stricter classification rule, it's making sure recurring operational asks actually get logged as work, even the small ones.
How moasy.tech computes it
moasy.tech recalculates toil ratio directly from synced work items and each team's configured capacity — no survey, no self-reported estimate. Toil classification uses the same semantic rules engine as every other work category, with team-level rules taking precedence over organization defaults, so a team that defines its own idea of Toil sees that reflected immediately. Per-contributor toil hours are also broken out, so a team lead can see whether toil is spread evenly or concentrated on one or two people.
See the full implementation on the Capacity & Workload feature page, or back up to Team Health for the other signals in this cluster.
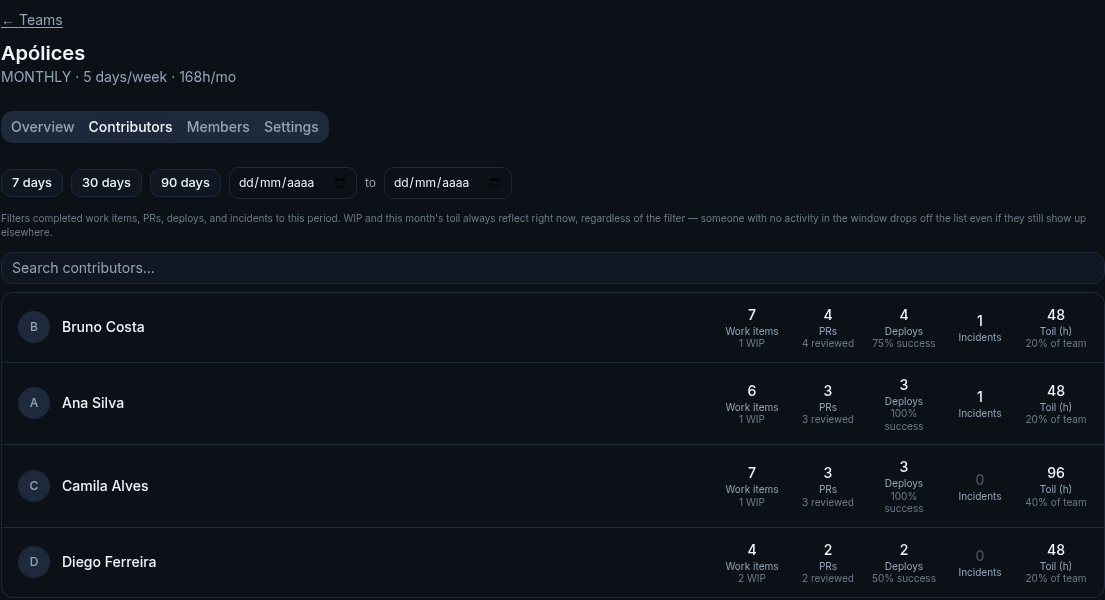
Illustrative data, for demonstration purposes only.
Questions about toil ratio
Why doesn't toil ratio respect the date range I pick elsewhere?
It's deliberately scoped to the current month, month-to-date against that month's full capacity — different from most other metrics, which do respect a chosen date range. That makes it useful for watching toil build up in real time, not for historical comparison across arbitrary periods.
Does toil ratio only count someone's primary team?
No — it sums capacity and toil hours across every team a contributor belongs to, scaled by each team's allocation percentage for that person.
Is a high toil ratio always a bad sign?
Not automatically — some functions (platform, IT-adjacent support) genuinely carry more recurring operational work by nature. It's most useful compared against that same team's own history, not against a fixed target shared across every team.
See your own team's toil ratio
Get started free