GUIDE
Deployment Frequency: What It Is and How to Calculate It
One of the 4 DORA metrics — how often your team ships code to production.
What it measures
Deployment frequency is how often code reaches production — daily, weekly, or somewhere in between. It's the simplest of the four DORA metrics to explain, but it matters for a subtler reason than "more deploys is better": frequency is a proxy for batch size. A team deploying multiple times a day is, almost by definition, shipping small, low-risk changes. A team deploying once a month is bundling weeks of work into a single release, which raises the odds that any one of those changes causes a problem.
Why it matters
Deploying more often isn't a vanity metric — it changes what a deploy actually feels like. A team shipping once a month treats every release as an event: a change freeze beforehand, a war room during, a retro after, because so much has accumulated that anything could go wrong. A team shipping several times a day treats a deploy as routine, almost boring, because each one carries so little that a problem is easy to spot and cheap to reverse. That shift — from "deploy is scary" to "deploy is Tuesday" — is the real prize behind the number, and it's also why deployment frequency correlates so strongly with the other 3 DORA metrics instead of trading off against them.
It also compounds with lead time in a specific way: a team that only ships once a week, no matter how fast a single change moves through review, is capped at shipping once a week. Frequency is the ceiling lead time bumps into — improving one without the other only gets a team so far.
How to calculate it
Count the number of deploys to production over a period, and express it as a rate — deploys per day, or per week. The part that actually requires a decision is what counts as a deploy: a merge to a main branch, a successful CI/CD pipeline run, or an artifact actually reaching a production environment. Picking the last one — an artifact live in production — gives the most honest signal, since the other two can happen without the change ever reaching a user.
A quick example: a team merges 40 pull requests in a month, runs 35 successful CI/CD pipelines (some merges get batched into one deploy), and 32 of those actually reach production (a few are held back by a feature flag or a blocked release window). The honest deployment frequency for that month is 32 — not 40, and not 35 — because that's the number of times a change genuinely reached a user.
Elite vs. typical performance
DORA's research groups teams into rough performance tiers. Elite performers deploy on demand, often multiple times a day. Teams in the middle tend to deploy somewhere between once a week and once a month. Lower performers deploy less than once a month. Treat these as a general sense of where a team sits, not a strict scorecard — the exact bands have shifted slightly across different years of the State of DevOps Report.
A common trap
Splitting one meaningful change into several small, mostly cosmetic deploys is a way to inflate the number without actually shipping more value or reducing risk — a deploy count going up while lead time and change failure rate stay flat is worth a second look. Frequency is meant to be a side effect of small batch sizes, not a target to chase on its own.
How moasy.tech computes it
moasy.tech recalculates deployment frequency automatically from what's already synced from GitHub Actions, ArgoCD, Vercel, Azure Pipelines and Waroom — read-only, no manual counting. What counts as a production deploy is configurable per team, with a company-wide default as fallback, so the "what counts" question is answered explicitly once instead of assumed differently by every team. Connect more than one CI/CD tool to the same team and moasy.tech also catches the risk of counting the same deploy twice, instead of quietly inflating the number.
See the other 3 DORA metrics in the full guide, or the complete implementation on the DORA Metrics feature page.
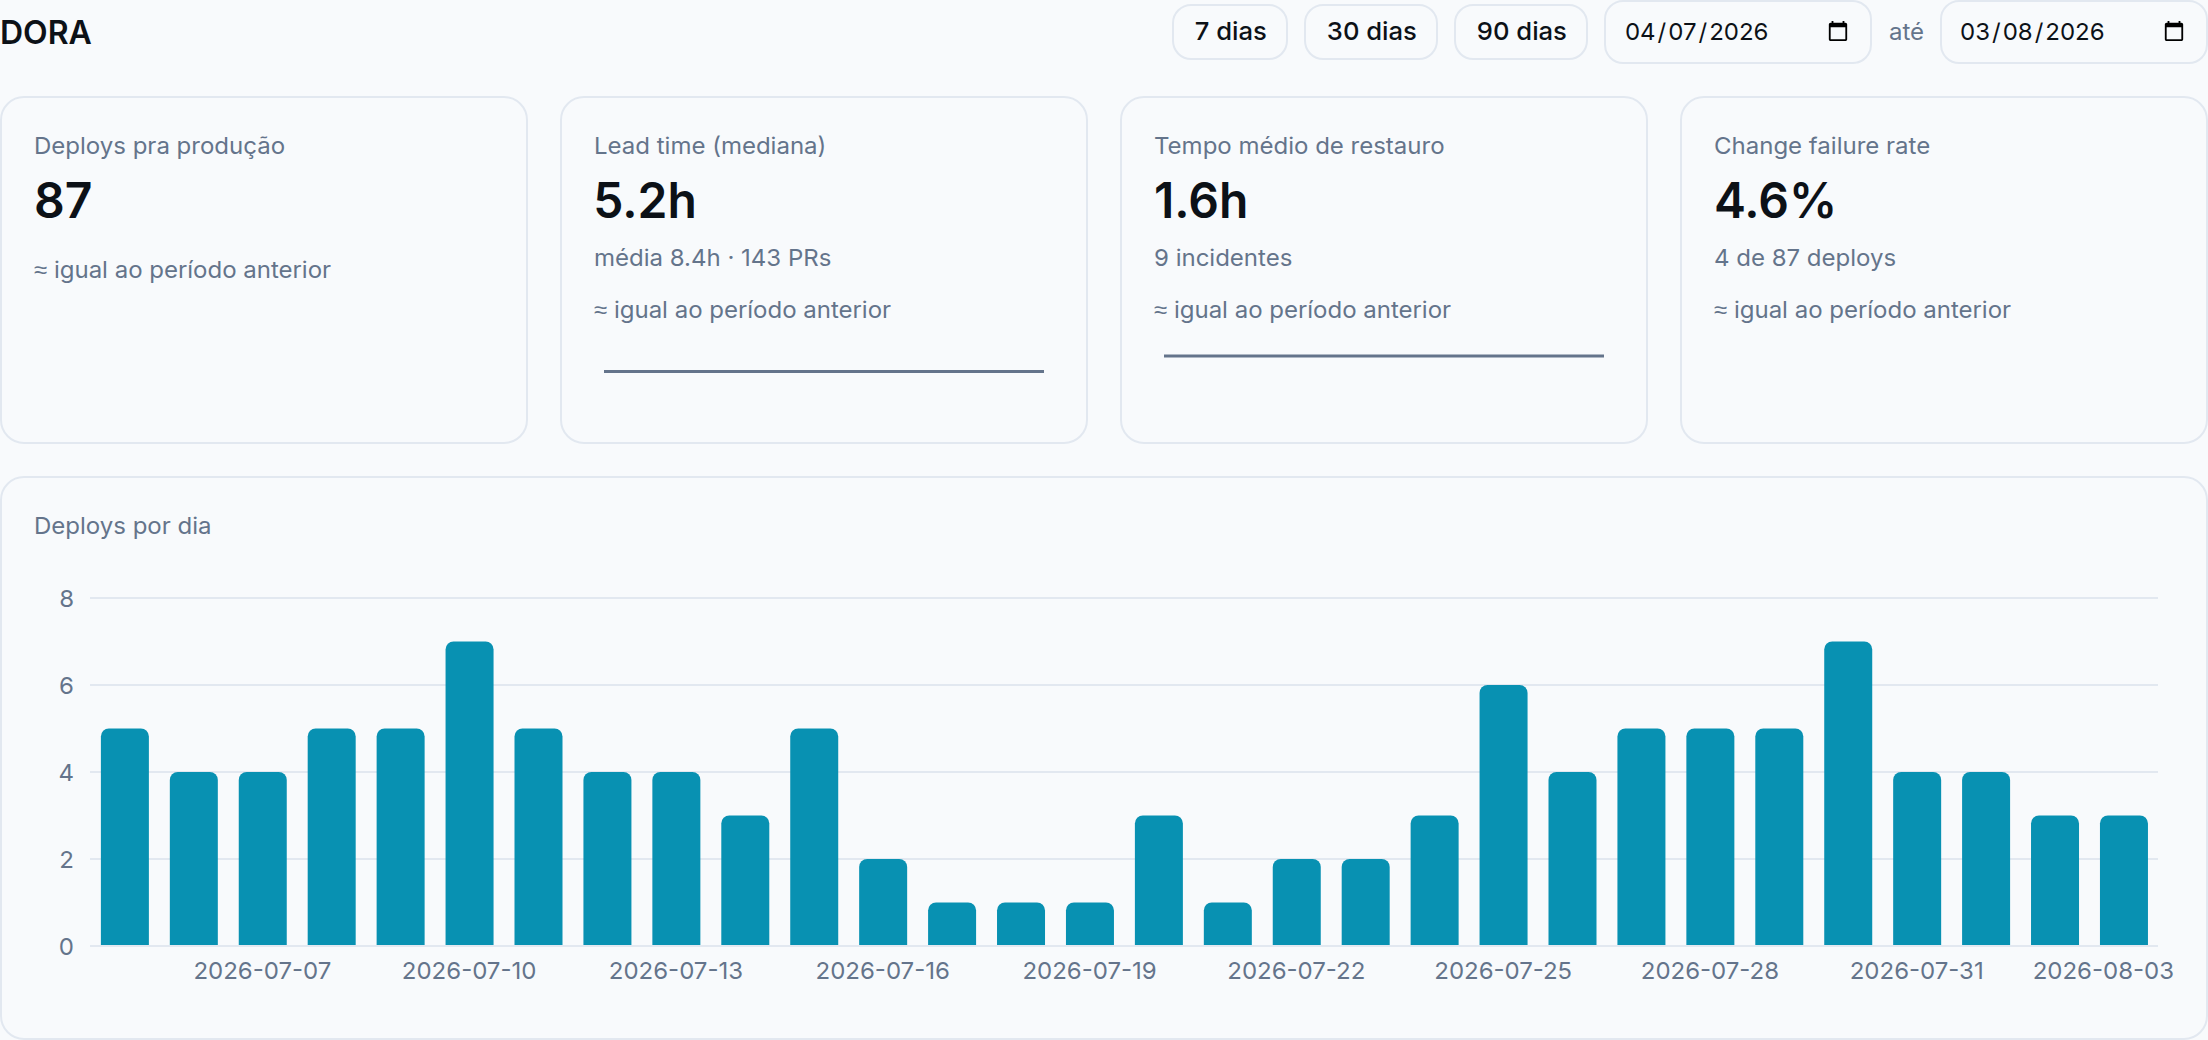
Illustrative data, for demonstration purposes only.
Questions about deployment frequency
What if we don't have a CI/CD pipeline?
You can count board transitions instead — moving a ticket to "Done", for example — as the deploy signal. It's a different source event, but the same underlying metric.
Does a rollback count as a deploy?
Most teams count it, since it's still a change reaching production — but it's a decision worth being explicit about and applying consistently, the same way "what counts as a deploy" needs an explicit answer in general.
Is deploying more always better?
Only alongside the other 3 DORA metrics. Deploying often with a rising change failure rate just means failures happen more often, not that delivery actually improved — frequency is one piece of the picture, not the whole scorecard.
See your own deployment frequency
Get started free